Price forecast weekly from 15th to 19th of June 2020
Grain market:
The June USDA report was published.
In summary: global wheat production increased thanks to the record production in India as well as increased yields in China, Turkey and Australia. All that is compensating the decline in the European Union and Ukraine’s production. Global consumption has been reduced mainly due to reduced feed and residue consumption in Australia and the European Union. Gross wheat harvest increased by 0.64% to 773.4 million tonnes.
The outlook for world maize production is up as the larger harvests in Brazil, Nicaragua and Zambia more than offset the decline in Vietnam. Gross maize harvests increased by 0.14 percent to 1188.5 million tonnes.
Thus, we can say that in a month we have not seen anything negative that can reduce the gross harvest, which brings us closer to the realization that wealth is guaranteed at 99%.
Under such conditions, it is difficult to expect price increasing on the grain market. Apparently, farmers should put up with low prices this year. Agrarian countries can be helped by weakening their own currencies against the US dollar. American farmers can still count on the economic recovery and government subsidies.
USD/RUB:
The FED meeting was held 10th June. The rate was left at the level of 0.25%. Chairman Powell had to admit the problems in the US economy. Moreover, he said that it is extremely difficult to predict the consequences of the quarantine for the economy now. The current unemployment rate of 13.3% may not reflect the whole situation and real figures may be higher by 3%. If it was not for the 2 million new jobs in May, the whole situation would be very sad.
Next week’s central event will be the CBR meeting. The rate is expected to be reduced by 1%, with a possible 0.75% reduction as well. Nabiullina’s statements give us a clear signal that the Central Bank will continue to reduce the cost of money as inflation is at low levels.
The pair will be able to rise above 70.00 next week if oil prices fall.
Energy market:
Cautious position of OPEC+ countries about further reduction of oil production caused a comedown on the market: prices preferred not to test the area 45.00 and turned down.
Oil consumption is recovering in China, but it is not clear to whom the export-oriented economy will sell its goods. In a couple of months we will realize that it will be impossible to talk about the same pace of development. Oil consumption is unlikely to reach levels that were before the quarantine.
Oil production in the US continues to decline. The level of 11.1 mn barrels per day is very optimistic against the background of the total reduction of active drilling rigs to 199. It is not excluded that in two or three weeks we will receive data on a sharp decline of domestic production of the US. And the figures will be less than 0.1 mn barrels that EIA draws for us now.
Wheat No. 2 Soft Red. CME Group

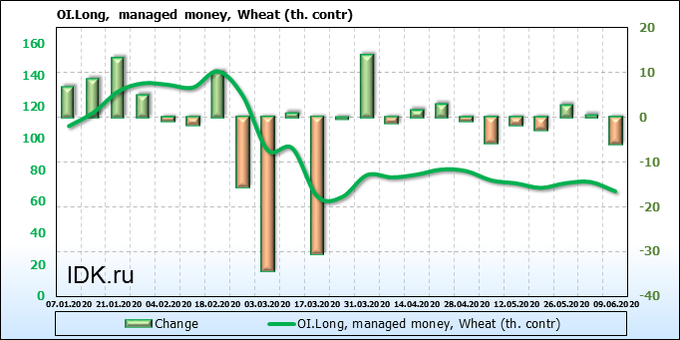
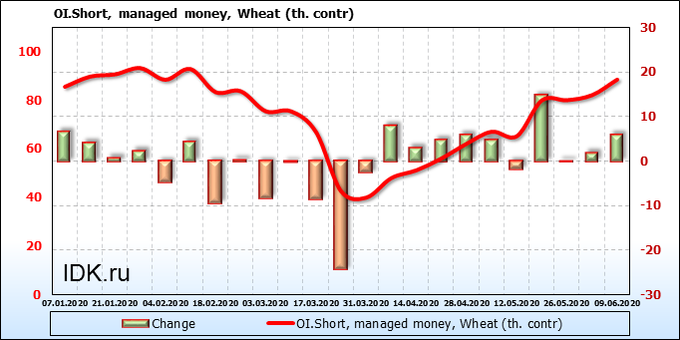
We’re looking at the volume of open interest of managers. You should keep in your mind that these are data from three days ago (for Tuesday of the past week), they are also the most recent of those published by the CME Group exchange.
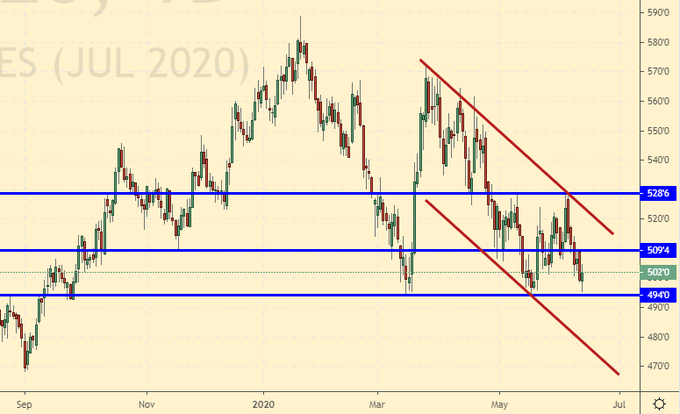
Speculators do not believe in market growth. And judging by the fact that after the USDA report prices went down again, there are more and more skeptics about the price rise from mid-June to the end of July.
Growth scenario: July futures, the expiration date is July 14. Prices managed to consolidate below 510.0, which creates prerequisites for the further decline. We don’t think about buying yet.
Downside scenario: the one who sold keeps your position. The market may bring a surprise this year. Prices may continue to fall, as traders have no fear about the fate of the future harvest.
Recommendation:
Buy: No.
Sell: no. If you are in position from 518.0, move the stop to 523.0. Target: 450.0.
Support – 494.0. Resistance – 509.4.
Corn No. 2 Yellow. CME Group
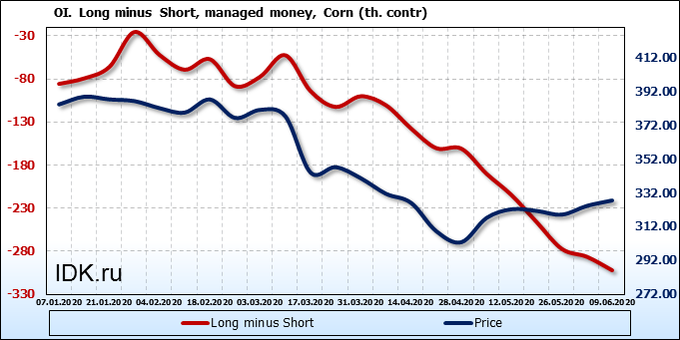
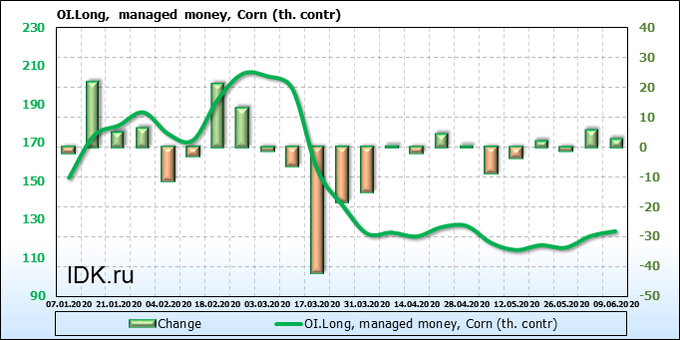
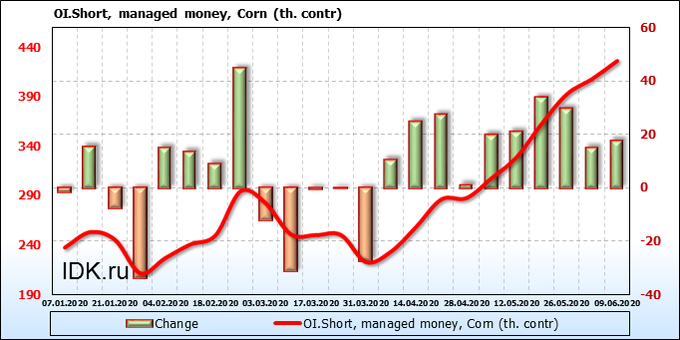
We’re looking at the volume of open interest of managers. You should keep in your mind that these are data from three days ago (for Tuesday of the past week), they are also the most recent of those published by the CME Group exchange.
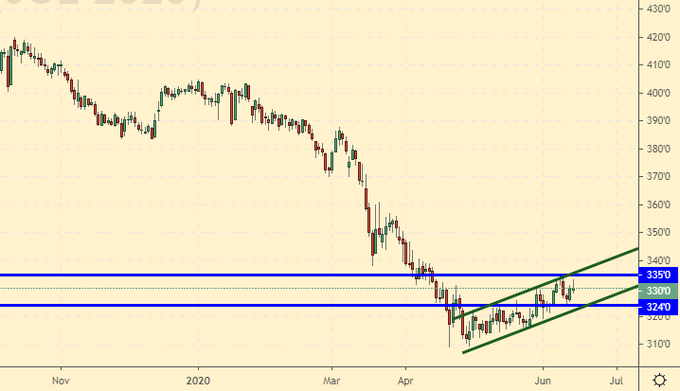
Sellers continue to destroy the market, but we see a small group of buyers hoping for growth. If all the sellers are trapped, we will see a sharp rise of prices.
Growth scenario: July Futures, the expiration date is July 14. The market gives us an opportunity to keep the longs opened from 315.0 and 325.0. It is possible to buy. Place the stop-order closer.
Falling scenario: we will not sell until we leave the growing channel. A possible scenario is when corn grows to 350.0 and wheat drops to 450.0. Thus, the spread between crops will become standard again and will be 100 cents per bushel.
Recommendation:
Buy: now. Stop: 317.0. Target: 350.0. Whoever is in position 315.0 and 325.0, hold the stop at 317.0. Target: 400.0?!
Sell: Possible by touching 317.0. Stop: 327.0. Target: 250.0?!
Support – 324.0. Resistance – 335.0.
Soybeans No. 1. CME Group
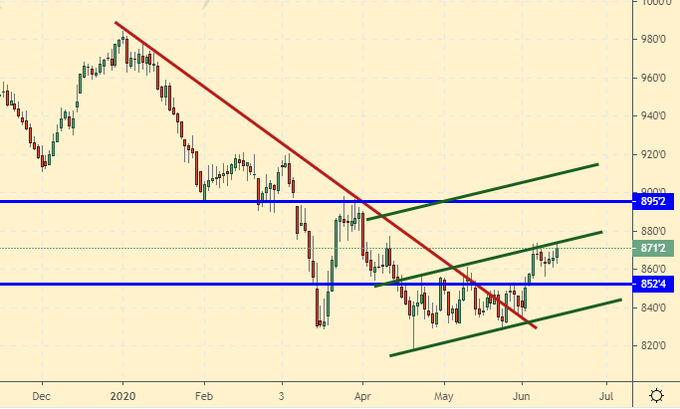
Growth scenario: July Futures, the expiration date July 14. It is too late to open new positions. We will keep our previous purchases open, hoping for a move to 900.0. If China recovers from the virus, US soybean exports will increase.
Falling scenario: a threat of passage above 880.0 exist. If it happens, the market will go to 900.0. But before the event happens, we will sell it from the current levels.
Recommendation:
Buy: No. Who is in position from 840.0, move the stop to 851.0. Target: 900.0 (1000.0?!).
Sell: Now. Stop: 877.0. Target: 750.0?! If you are in position, move the stop to 877.0. Target: 750.0.
Support – 852.4. Resistance – 895.2.
Sugar 11 white, ICE
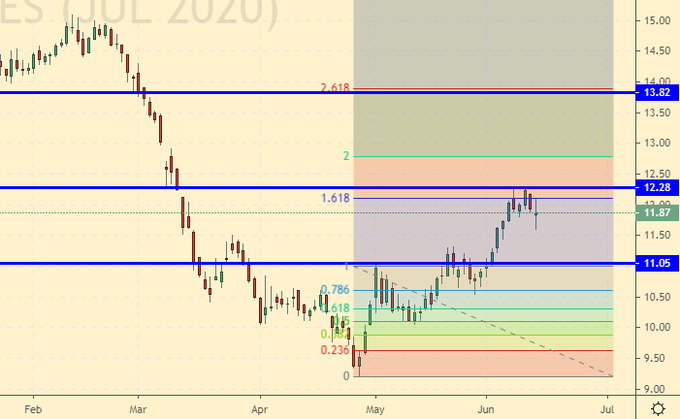
Growth scenario: July Futures, the expiration date is June 30. We need a rollback by 11.07 to buy. The current levels to enter the long are high.
Falling scenario: continue to recommend selling from the current levels. Maybe aggressively. At least, we expect a pullback by 11.07.
Recommendation:
Buy: to think after a rollback by 11.07.
Sale: now. Stop: 12.19. Target: 11.07.
Support – 11.05. Resistance – 12.28.
Сoffee С, ICE
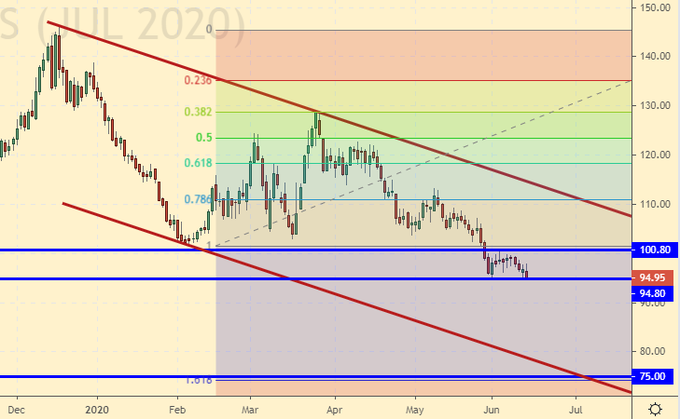
Growth scenario: July Futures, the expiration date July 21. The market tends to blow it’s brains and fall by 75.00. If it will happen, you can buy aggressively from 75.00.
Falling scenario: the situation for bears develops perfectly. On Thursday, they showed a new minimum, 94.60. We keep standing in shorts. Once again, we move the stop order along the trend, we believe in falling by 75.00!
Recommendation:
Buy: by touching 76.00. Stop: 72.00. Target: 99.00.
Sale: No. Who is in position, from 112.00 and 100.00, move the stop to 104.0. Target: 76.00?!
Support – 75.00. Resistance – 100.80.
Brent. ICE
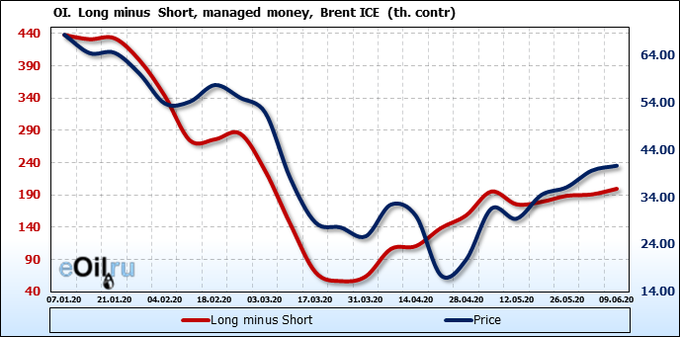
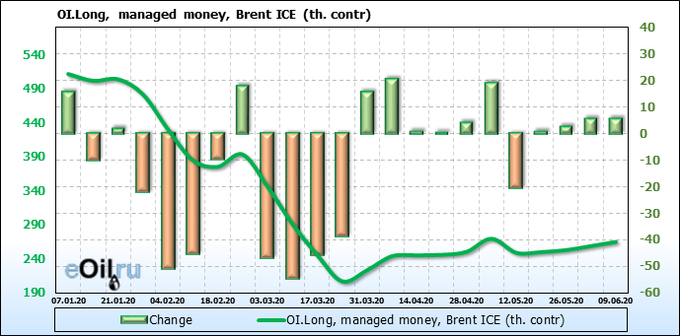
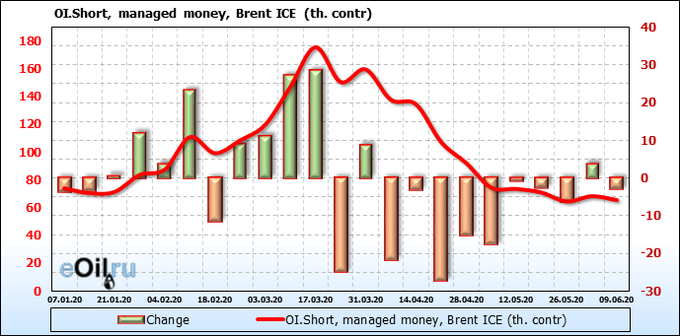
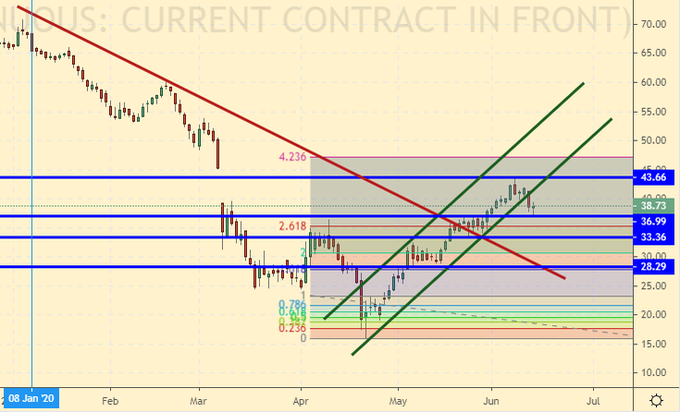
Buyers are still refuse to accept the fact that there should be a correction in the market. Sellers seemed to believe that the market is capable of approaching 45.00. Speculative buying contracts for more than 200,000 units, it will support the market.
Growth scenario: June Futures, the expiration date June 30. Prices came out of the growing channel. We will expect a drop by 30.00, where we could buy.
Falling scenario: without moving by 47.00, the picture looks incomplete. We continue to recommend aggressive sales from 46.50. The second variant, sales at rise to 40.00 on condition that SP500 will continue to fall.
Recommendation:
Buy: no. Who is in position from 31.50, move the stop to 36.80. Target: 45.90.
Sell: by touching 46.50. Stop: 47.90. Target: 35.60 (28.60?).
Support – 36.99. Resistance – 43.66.
WTI. CME Group
Fundament: the number of oil drilling rigs in US dropped by 7 to 199.
Commercial oil reserves in the USA rose by 5.72 to 538,065 million barrels. Gasoline reserves increased by 0.866 to 258,661 mn barrels. Distillate inventories increased by 1,568 mln barrels to 175,829 mln barrels. The Cushing storage capacity dropped by -2,279 mn barrels to 49,444 mn barrels.
Oil production fell by -0.1 mn barrels to 11.1 mn barrels per day. Imports of oil rose by 0.685 mn barrels to 6.864 mn barrels per day. Crude oil exports dropped by -0.355 mn barrels per day to 2.439 mn barrels per day. Thus, net oil imports increased by 1.04 to 4.425 mn barrels per day. Oil processing grew by 1.3 to 73.1%.
Gasoline demand grew by 0.351 to 7.9 mn barrels per day. Gasoline production increased by 0.36 to 8.139 mln barrels per day. Gasoline imports fell by -0.153 to 0.629 mln barrels per day. Gasoline exports increased by 0.045 mn barrels per day to 0.308 mn barrels per day.
Demand for distillates increased by 0.584 mn barrels to 3.302 mn barrels. Distillate production increased by 0.048 mn barrels to 4.762 mn barrels. Imports of distillates increased by 0.014 to 0.177 mln barrels. Distillate exports increased by 0.673 million barrels to 1.413 million barrels per day.
Demand for petroleum products increased by 2.507 mn barrels to 17.573 mn barrels. Distillate production increased by 1,114 mmb to 20,034 mn barrels. Imports of distillates increased by 0.225 mln barrels to 2.059 mln barrels. Gasoline exports increased by 0.192 mln barrels to 4.618 mln barrels per day.
Propane demand increased by 0.674 mn barrels to 1.263 mn barrels. Propane production increased by 0.108 to 2.097 mln barrels. Propane imports increased by 0.042 to 0.11 mln barrels. Propane exports increased by 0.067 to 1.094 mln barrels per day.
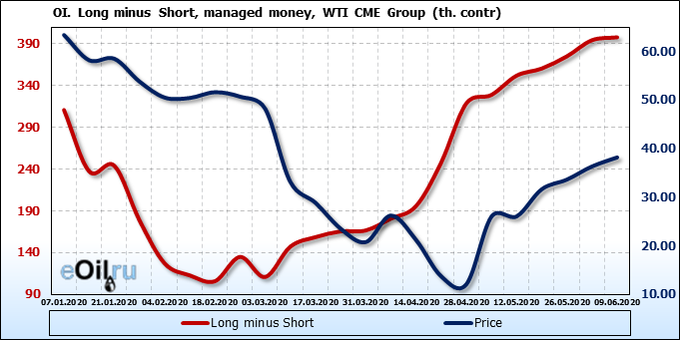
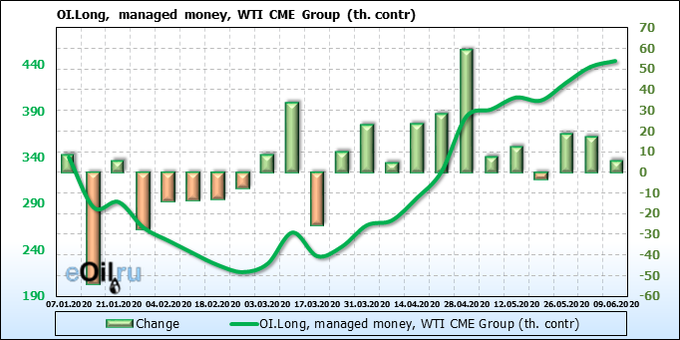
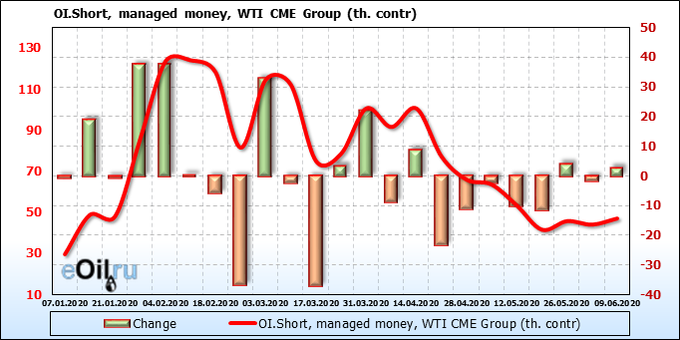
We’re looking at the volume of open interest of managers. You should keep in your mind that these are data from three days ago (for Tuesday of the past week), they are also the most recent of those published by the CME Group exchange.
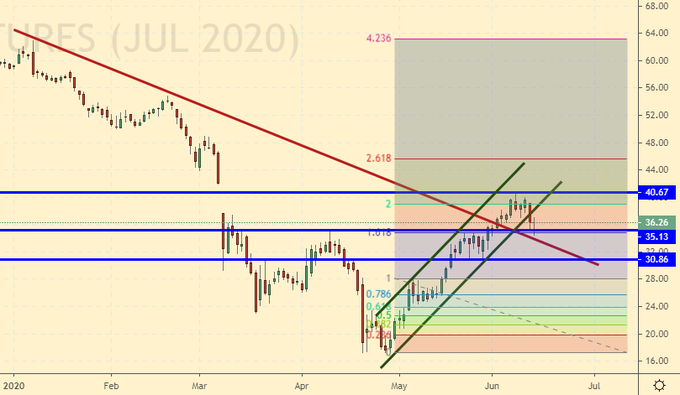
Buyer’s activity is fading out. Sellers have started to demonstrate the interest to the situation. They are few yet, but as the market grows by 45.00 their number will increase.
Growth scenario: July Futures, the expiration date is June 22. The current levels remain overvalued for purchases. We have to wait for correction at 28.00 — 30.00 in order to buy.
Falling scenario: the maximum was on Monday at 40.44. It means that the sale at 40.00 is still alive, as the stop order was at 40.60. Let’s move it down the trend. We have a danger of another wave of growth that should end around 45.00. You should sell there and maybe aggressively.
Recommendation:
Buy: think when you roll back to around 30.00.
Sale: to sell from 45.00 obligatory. Stop: 47.30. Target: 31.60. Who is in position, from 40.00, move the stop to 39.80. Target: 29.00.
Support – 30.86. Resistance – 40.67.
Gas-Oil. ICE
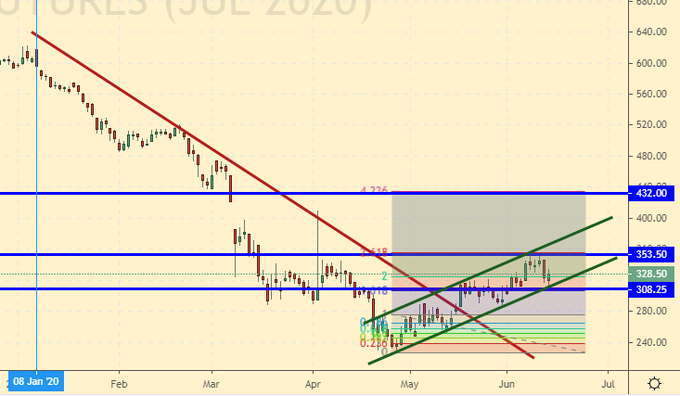
Growth scenario: July Futures, the expiration date is July 10. We continue to believe that growth to 430.0 is possible. We are at the bottom of the growing channel. We can buy here.
Falling scenario: a double top at 350.0 gave us a chance to sell. If you entered the short at 350.0 hold the position. If you didn’t sell, wait for the rise to 430.0.
Recommendation:
Buy: Now. Stop: 298.0. Target: 430.0. Whoever’s in position 305.0, move the stop to 298.0.
Target: 430.0.
Sell: sell from 430.0 obligatory. Stop: 446.0. Target: 312.0. Whoever is in position from 350.0, move the stop to 356.0. Target: 280.0.
Support – 308.25. Resistance – 353.50.
Natural Gas. CME Group
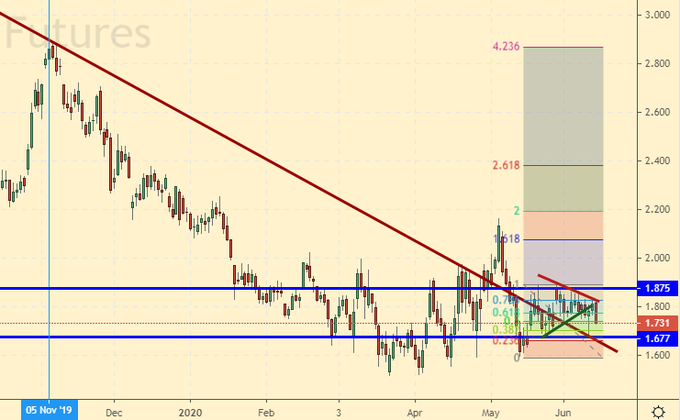
Growth scenario: July futures, the expiration date is June 26. Too bad, but we didn’t go up. The gas sector in US is now in a decline stage. As you know, 30% of natural gas in the U.S. is extracted by-product of oil during hydraulic fracturing. Thus, gas production in the USA will fall, which will affect prices. In case of growth above 1.800, we buy it again.
Falling scenario: the market is unlikely to go below 1.6000. However, if Germany bypasses all EU and US restrictions and gets a second Nord Stream pipeline filled with gas from Russia, then it will be possible to talk about the market falling to 1.5000.
Recommendation:
Buy: in case of growth above 1.800. Stop: 1.690. Target: 2.370.
Sale: No.
Support – 1.677. Resistance – 1.875.
Gold. CME Group
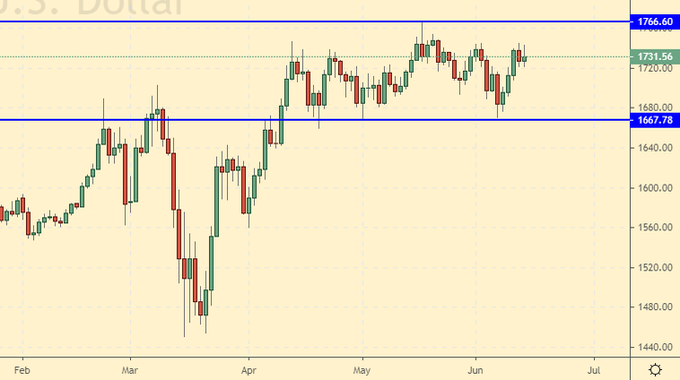
Growth scenario: the FED Chairman did not calm down investors on Wednesday at all. Having heard the horrors from Powell on Wednesday, the SP500 index decided to fall by 6% on Thursday. It’s too much frankly. The falling of the index gives a chance for gold to rise to 1820. It’s a better move to work on 1H intervals if prices rises above 1770.
Falling scenario: the stop order at 1747 is still alive. The situation isn’t easy. We grew too high last week. Don’t open new positions, keep the old ones.
Recommendation:
Buy: No. You can try on 1H timeframes after rising 1770. Target: 1820?
Sale: No. If you’re in position from 1730, hold the stop at 1747. Target: 1400?!
Support – 1667. Resistance – 1766.
EUR/USD
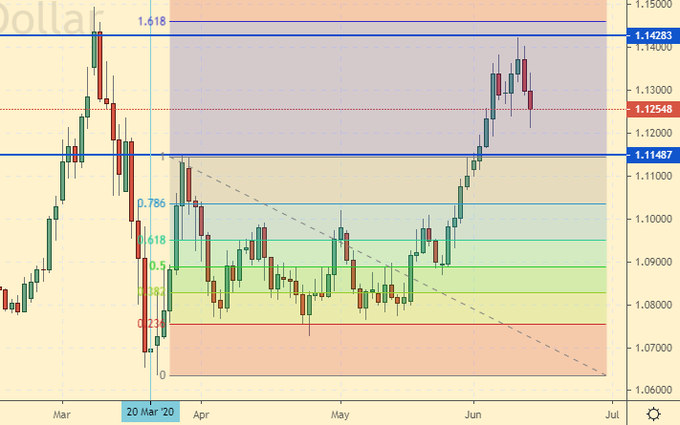
Growth scenario: who would have thought! Powell really upset the markets. The bad situation in the U.S. economy opens the way to increase the government debt. Now it already amounts to 26 trillion dollars and it is not funny, because four years ago the amount was 19.6 trillion dollars. No profit, no taxes, no budget revenues, the percentage of spending on servicing the current debt is growing. You can buy a pair from 1,000.
Falling scenario: wait with the opening of new shorts. If the market falls below 1.1000, we will sell.
Recommendation:
Buy: Think when approaching 1.1000. Who is in position from 1.0800, hold the stop at 1.0970. Target: 1.1480 (1.2000).
Sale: think after falling below 1.1000.
Support – 1.1148. Resistance – 1.1428.
USD/RUB
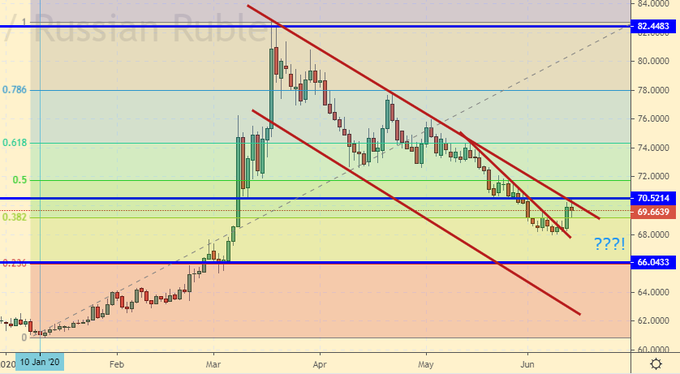
Growth scenario: we continue to believe that it is necessary to buy a lot from the area 67.00. The second option is to grow above 70.60. In this case, the prices will come out of the falling channel and there will be technical prerequisites for the move to 78.00.
Falling scenario: before the prices leave the channel, we can sell. Despite the fact that our stop at 70.37 worked, we enter the shorts again.
Recommendation:
Buy: after rising above 70.60. Stop: 69.40. Target: 78.00. Who is in position, from 68.00, move the stop to 68.20. Target: 78.00.
Sell: Now. Stop: 70.70. Target: 66.10.
Support – 66.04. Resistance – 70.52.
RTSI
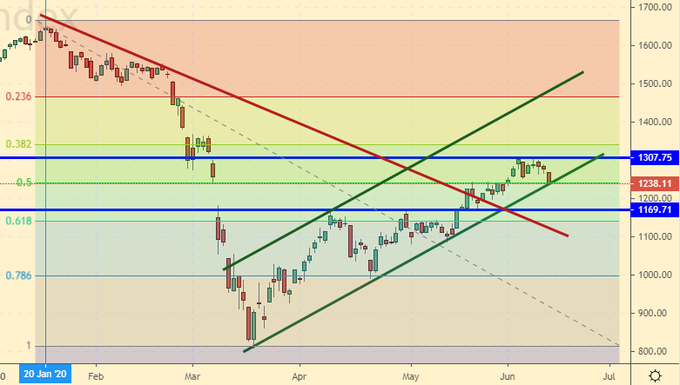
Growth scenario: the fall of SP500 on Thursday set a negative mood for the whole market. There is a risk of falling below 1230, which will lead to the exit from the growing price channel and the prospect of a moving to the area of 1000.0. There might be a gap down on Monday.
Falling scenario: it is unlikely that in 2021 companies will pay any dividends based on 2020 results. All participants understand this, so the downside move will be perceived quite calmly. Sell if it falls below 1230.
Recommendation:
Buy: no. Who is in position from 1170, hold the stop at 1230. Target: 1330 (1450).
Sell: If you touch 1230. Stop: 1280. Target: 600?!
Support – 1169. Resistance – 1307.
The recommendations in this article are NOT a direct guide for speculators and investors. All ideas and options for working on the markets presented in this material do NOT have 100% probability of execution in the future. The site does not take any responsibility for the results of deals.
