Price forecast from 17 to 21 March 2025

A white-haired, tall, but aged man walks into a cell phone shop and starts talking to the saleswoman. Show her this phone and that one. And then he left, he didn’t buy anything, but one phone is missing. So… didn’t Trump intern with our gypsies at some train station?
To divorce resistance. Hello!
This release was prepared with the direct participation of analysts from trading platforms eOil.ru and IDK.ru. Here is an assessment of the situation on the global and Russian markets.
Grain market:
We are unlikely to see very bad events in the grain market, as demand is not going anywhere. But we may see some Canada in August frantically looking for an extra couple of million tons, because this country has a trade war with the USA and because of that some farm in Canada will be able to buy grain at a very good price. It’s time for spot deals and hustlers with free capital. The same is true for grain from the USA. It can be turned into Brazilian grain on paper, for example, and sold to China, which has imposed high duties on direct shipments from overseas. Electricity schemes are not that complicated compared to trade schemes.
In Russia, 87% of winter crops are in good to satisfactory condition. These figures are much more cheerful than the December doubts that arose due to weather problems. For Russia to get 80 million tons of wheat in the 2025/2026 season is realistic, provided that the weather does not present an extremely unpleasant surprise. Thus, exports can be estimated at 40 million tons. But there is a question for the future similar to the oil question: what will the customers pay with. Everyone realizes that the West may strengthen sanctions, which may lead to significant losses in settlements. What to do? Bitcoin, gold bars, what else? We can standardize payment with large diamonds from 10 carats. And good old barter. Why not? We give you wheat, you give us bananas. That’s fine. Calories for calories.
Energy market:
American sanctions against the Russian energy sector have been extended. This, on the whole, important event was somehow quiet, behind a screen. No horror, no panic on the stock exchange. The L8 license has not been extended, which makes it much more difficult for foreign companies to buy energy resources from Russia. There are reasons to believe that Trump will impose even tougher sanctions against Russian oil and gas exports if Russia refuses to ceasefire in Ukraine. Against this backdrop, the oil market is trying to show survivability, but structurally it looks heavy and it would be no surprise that we will hit the 60.00 mark in a couple weeks, sanctions or not.
And we have more and more transactions going through bitcoins. And what does not go through crypto is split into small batches and brought to us in tugriks, bunnies, and whatever else is available. Of course, this is a great story for the middlemen, but direct losses for Russia and commodity companies.
Chinese refineries are cutting back on purchases of Russian oil, following the Indians, due to sanctions pressure. In addition, the Turks have decided to buy… Brazilian oil. That’s funny, yeah. These actions have not been reported in the export reports yet, but it is possible that we will see a decline in supplies to Asia in the second quarter. Where will the growth go then? China wants to wait to see if there will be a ceasefire in Ukraine and if not, what Trump will pull out in that case. The American president will be furious if his efforts are in vain, that’s understandable. But it is hardly a question of the economy in principle at this stage, much less Trump’s emotions.
USD/RUB:
We are waiting for the meeting of the US Fed on Wednesday and the Central Bank of Russia on Friday. Most likely, neither Russia nor the US rates will change.
The current strengthening of the ruble can still be justified by a possible ceasefire (why it is needed), but suddenly. Hope for some kind of resumption of economic cooperation with the solvent West. And also by the fact that imports into the country have begun to decline, which leads to a surplus of yuan, dollars and something similar to dollars: all sorts of euros, francs, dirhams. Oh, and the Polish zloty, too. Just kidding.
We are waiting for an attempt to pass to 82.00, after which the market is likely to stop. Further and current strengthening of the currency is not favorable for the budget.
Wheat No. 2 Soft Red. CME Group
Let’s look at the volumes of open interest in Wheat. You should take into account that this is three days old data (for Tuesday of last week), but it is also the most recent data published by CME Group.
At the moment there are more open short positions of asset managers than long ones. During the past week the difference between long and short positions of asset managers decreased by 6.3 th. contracts. In extremely small volumes buyers entered the market, sellers left it. Bears are controlling the situation.
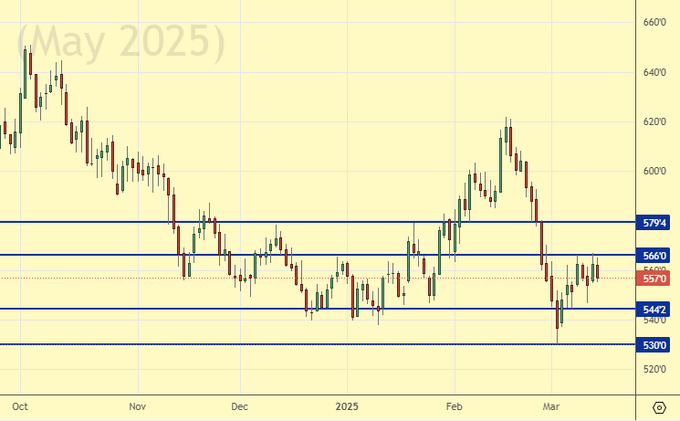
Growth scenario: we consider the May contract, expiration date May 14. Intrigue. And if it will be 500.0 after all. We do not buy at current levels.
Downside scenario: some confusion around 550.0. Let’s put this story to the test. In case we fall.
Recommendations for the wheat market:
Buy: obligatory when approaching 500.0. Stop: 400.0. Target: 700.0.
Sell: Now (557.0). Stop: 673.0. Target: 500.0. Count the risks!
Support — 544.2. Resistance — 566.0.
Corn No. 2 Yellow. CME Group
Let’s look at the volumes of open interest in Corn. You should take into account that this data is three days old (for Tuesday of last week), it is also the most recent of those published by the CME Group exchange.
At the moment there are more open long positions of asset managers than short ones. During the past week the difference between long and short positions of asset managers decreased by 74.4 th. contracts. Buyers continued to leave the market. Sellers were arriving. Bulls may lose control in the nearest future.
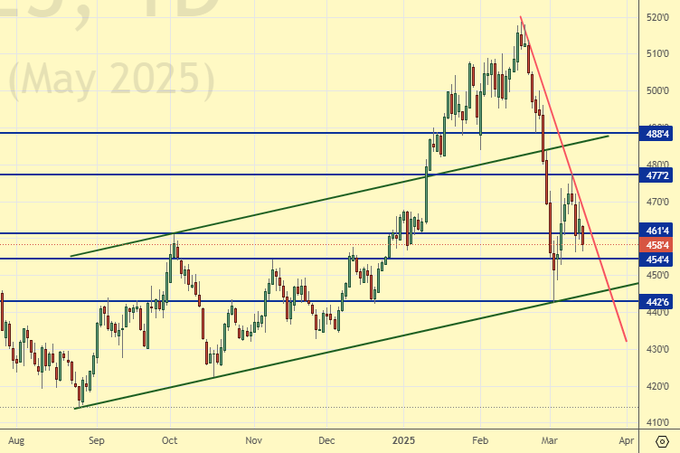
Growth scenario: we consider the May contract, expiration date May 14. We should keep longing. If it does not survive, we will buy from deeper levels. Globally, this is a win-win tactic.
Downside scenario: you can sell on a pullback up to 472.0. Setting a new low in this market cannot be ruled out. We can go to 380.0.
Recommendations for the corn market:
Buy: no. Who is in position from 444.0, keep stop at 445.0. Target: 510.0.
Sell: on approach to 472.0. Stop: 482.0. Target: 380.0?!!!
Support — 454.4. Resistance — 477.2.
Soybeans No. 1. CME Group
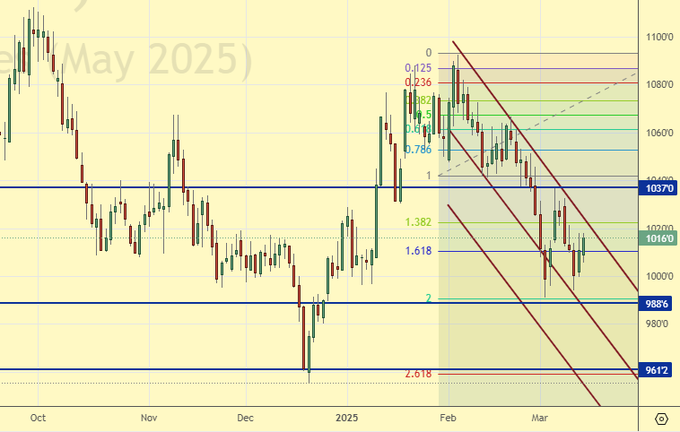
Growth scenario: we consider the May contract, expiration date May 14. Buying is neither fundamentally nor technically interesting. Out of the market.
Downside scenario: hold shorts in expectation of a strong fall.
Recommendations for the soybean market:
Buy: no.
Sell: no. Those who are in position from 1025.6, move the stop to 1032.0. Target: 878.0.
Support — 988.6. Resistance — 1037.0.
Brent. ICE
Let’s look at the open interest volumes for Brent. You should take into account that this is three days old data (for Tuesday of last week), and it is also the most recent data published by the ICE exchange.
At the moment there are more open long positions of asset managers than short ones. During the past week the difference between long and short positions of asset managers decreased by 8.8 th. contracts. There is an outflow of buyers and sellers on the market. Money is leaving, making the situation thinner. Bulls are controlling the situation for now.
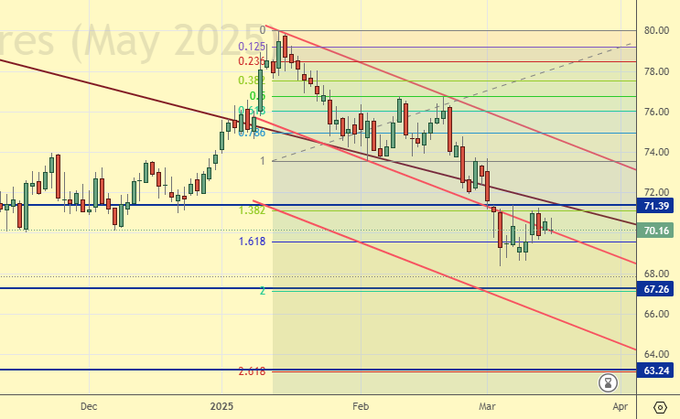
Growth scenario: we consider March futures, expiration date March 31. Nothing new for the week. So far we can’t turn upwards. It is worth buying from 63.30, but we need to get there first.
Downside scenario: it is worth being patient and keeping shorts. The consequences of a trade war could be severe for the oil market.
Recommendations for the Brent oil market:
Buy: when approaching 63.30. Stop: 62.00. Target: 72.00.
Sell: no. Those in position from 74.05, move stop to 72.10. Target: 63.30 (revised).
Support — 67.26. Resistance — 71.39.
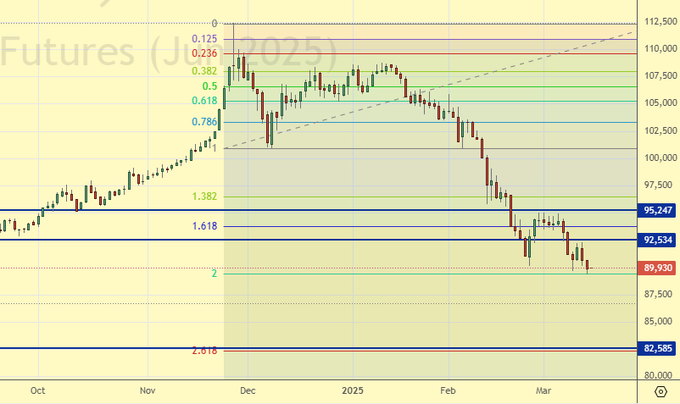
WTI. CME Group
US fundamentals: the number of active drilling rigs increased by 1 unit to 487.
U.S. commercial oil inventories rose by 1.448 to 435.223 million barrels, with a forecast of +2.1 million barrels. Gasoline inventories fell by -5.737 to 241.101 million barrels. Distillate stocks fell -1.559 to 117.595 million barrels. Cushing storage stocks fell by -1.228 to 24.469 million barrels.
Oil production rose by 0.067 to 13.575 million barrels per day. Oil imports fell by -0.343 to 5.47 million barrels per day. Oil exports fell by -0.846 to 3.29 million barrels per day. Thus, net oil imports rose by 0.503 to 2.18 million barrels per day. Oil refining rose by 0.6 to 86.5 percent.
Gasoline demand rose by 0.305 to 9.182 million barrels per day. Gasoline production fell -0.078 to 9.556 million barrels per day. Gasoline imports fell -0.025 to 0.578 million barrels per day. Gasoline exports rose -0.024 to 0.84 million barrels per day.
Distillate demand fell -0.093 to 3.898 million barrels. Distillate production fell -0.113 to 4.462 million barrels. Distillate imports fell -0.02 to 0.249 million barrels. Distillate exports fell -0.005 to 1.036 million barrels per day.
Demand for petroleum products increased by 1.057 to 21.6 million barrels. Petroleum products production fell by -0.168 to 21.479 million barrels. Petroleum product imports fell -0.114 to 1.966 million barrels. Exports of refined products fell -0.778 to 6.228 million barrels per day.
Propane demand increased by 0.551 to 1.609 million barrels. Propane production rose 0.007 to 2.697 million barrels. Propane imports fell -0.058 to 0.145 million barrels. Propane exports fell -0.53 to 1.718 million barrels per day.
Let’s look at the WTI open interest volumes. You should take into account that this is three-day old data (for Tuesday of last week), and it is also the most recent data published by the CME Group exchange.
At the moment there are more open long positions of asset managers than short ones. Over the past week the difference between long and short positions of asset managers increased by 9.1 th. contracts. There were no buyers. Sellers continued to leave the market. Bulls keep control.
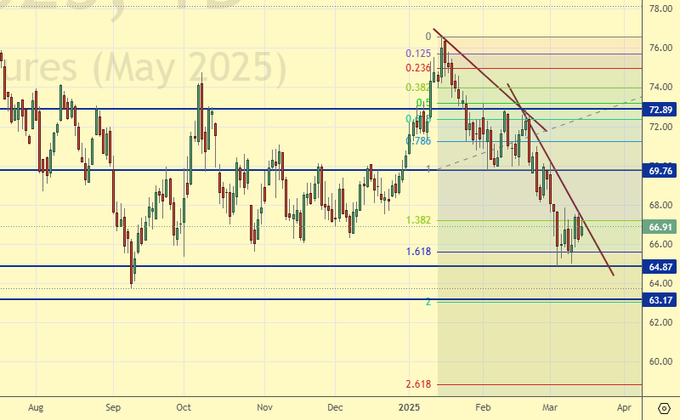
Growth scenario: we switched to May futures, expiration date April 22. We are waiting for more interesting points for water in long. So far out of the market.
Downside scenario: you can see that the Arabs are shaken. They will offer discounts. It makes sense to keep shorts.
Recommendations for WTI crude oil:
Buy: at 59.05. Stop: 58.05. Target: 68.00.
Sell: no. Those who are in the position from 69.34 (taking into account the transition to a new contract), move the stop to 68.02. Target: 59.05.
Support — 64.87. Resistance — 69.76.
Gas-Oil. ICE
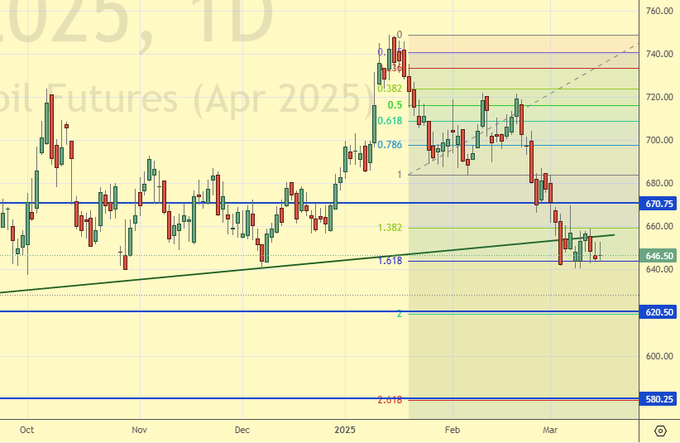
Growth scenario: we consider April futures, expiration date is April 9. We continue to believe that we should wait for the downward momentum to fully work out, which will probably happen at 580.0.
Downside scenario: if there is a rise, it can be used to enter short.
Gasoil Recommendations:
Buy: when approaching 580.0. Stop: 570.0. Target: 680.0.
Sell: on approach to 680.0. Stop: 700.0. Target: 580.00. Or now (646.50). Stop: 665.0. Target: 580.0.
Support — 620.50. Resistance — 670.75
Natural Gas. CME Group
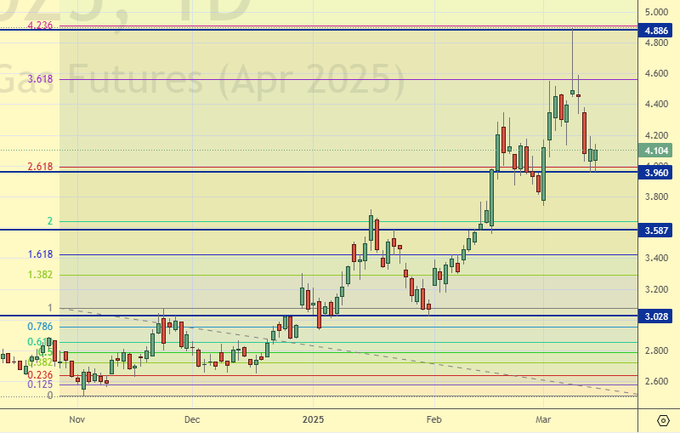
Growth scenario: we consider April futures, expiration date March 27. Rolled back, but we would like to get 3.100 for a new long.
Downside scenario: we have entered the shorts. Gotta hold. Winter’s gone. Summer is ahead. Prices may still fall.
Natural Gas Recommendations:
Buy: when approaching 3.100. Stop: 2.800. Target: 3.900.
Sell: No. Those in position from 4.880, move your stop to 4.200. Target: 3.100.
Support — 3.960. Resistance — 4.886.
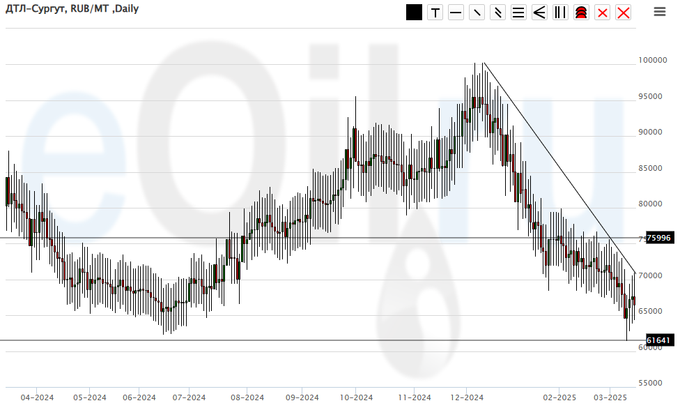
Diesel arctic fuel, ETP eOil.ru
Growth scenario: knocked out of buying. We take a pause.
Downside scenario: we will not sell anything. There is a constant risk of a sudden rise in prices.
Diesel Market Recommendations:
Buy: no.
Sale: no.
Support — 61641. Resistance — 75996.
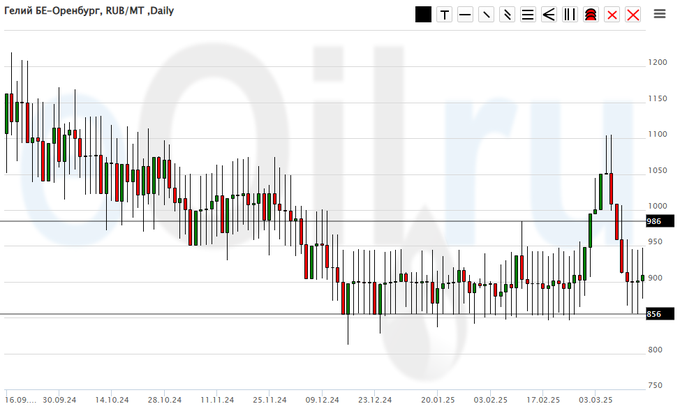
Helium (Orenburg), ETP eOil.ru
Growth scenario: the stop was knocked out, we will come in again. There can be only growth in this market.
Downside scenario: stay out of the market, prices are low.
Helium market recommendations:
Buy: Now (900). Stop: 850. Target: 2000.
Sale: no.
Support — 856. Resistance is 986.
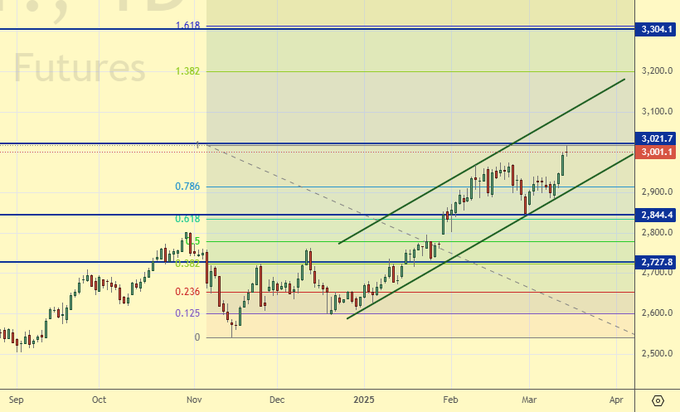
Growth scenario: we consider the March futures, expiration date March 27. We continue to believe that when approaching 2730 we can try to buy. There is nothing else interesting here.
Downside scenario: we see the fulfillment of the Fibo target at 3020. We should now get a pullback. But how deep it will be is still a question. And then there will be another branch upwards, somewhere towards 3300.
Gold Market Recommendations:
Buy: when approaching 2730. Stop: 2710. Target: 3020.
Sale: now (3001). Stop: 3034. Target: 2120.
Support — 2844. Resistance — 3021.
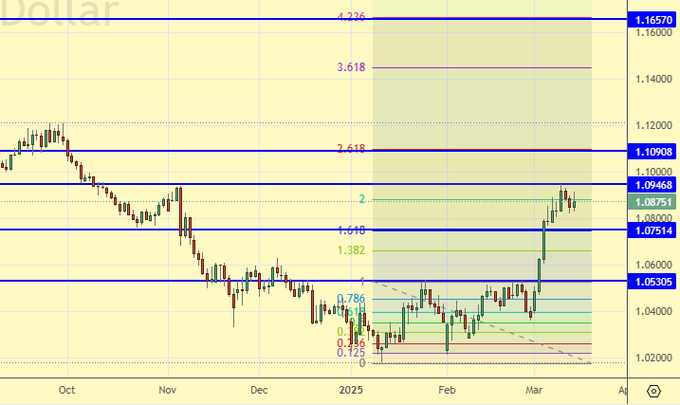
EUR/USD
Growth scenario: we will wait for a pullback to 1.0550. It is uncomfortable to buy from current levels.
Downside scenario: knead 1.0900. We can sell, but we should be ready for a move to 1.1090, so the capital risk should be reduced threefold.
Recommendations on euro/dollar pair:
Buy: on a pullback to 1.0550. Stop: 1.0450. Target: 1.1090 (1.2000).
Sell: now (1.0875). Stop loss: 1.0956. Target: 1.0550.
Support — 1.0751. Resistance — 1.0946.
USD/RUB
Growth scenario: switched to June futures, expiration date June 19. From 82600 to buy unequivocally.
Downside scenario: we have no right to miss the move to 82500. However! We are at 2.000 Fibonacci level, which may lead to a move back to 100000. Those who are not in a position, practice a move down on the watch.
Recommendations on dollar/ruble pair:
Buy: when approaching 82600. Stop: 81400. Target: 115000?!!!
Sell: no. Who is in the position from 92186 (taking into account the transition to a new contract), move the stop to 92700. Target: 82600.
Support — 82585. Resistance — 92534.
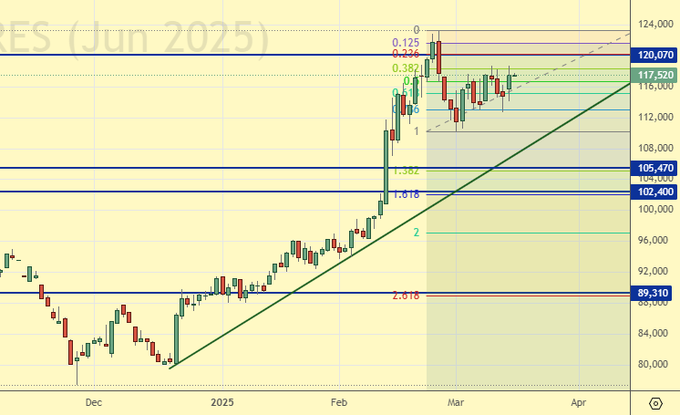
RTSI. MOEX
Growth scenario: we switched to the June futures, expiration date June 19. We are facing a correction to the fall. It makes sense to expect another downward price branch. Further growth without correction will mark the beginning of a mad bacchanalia, which, when everything will be strongly up, will end with closing of all stock exchanges for a month and storming of savings banks.
Downside scenario: the idea remains the same. If there will be an approach to 120000 — sell. Within the correction we can draw the trajectory 120000 — 105500. And if everything will be much worse than imagined by the magicians (they are puppeteers), then 90000 is waiting for us. And then 60000. Yes, yes, yes, this mark is far away, but it is there, it is with us.
Recommendations on the RTS index:
Buy: when approaching 105500. Stop: 103000. Target: 138000?!!! Also on approach to 89500. Stop: 88300. Target: 110000.
Sell: when approaching 120000. Stop: 122,000. Target: 105000.
Support — 110030. Resistance — 123310.
The recommendations in this article are NOT a direct guide for speculators and investors. All ideas and options for working on the markets presented in this material do NOT have 100% probability of execution in the future. The site does not take any responsibility for the results of deals.