
22.12
|
||||||||
|
< | Декабрь | > | < | 2024 | > |
| пн | вт | ср | чт | пт | сб | вс |
|---|---|---|---|---|---|---|
| 1 | ||||||
| 2 | 3 | 4 | 5 | 6 | 7 | 8 |
| 9 | 10 | 11 | 12 | 13 | 14 | 15 |
| 16 | 17 | 18 | 19 | 20 | 21 | 22 |
| 23 | 24 | 25 | 26 | 27 | 28 | 29 |
| 30 | 31 | |||||
Grain market:
If you are worried about the ruble falling against the yuan, don’t worry, you are in the market. Something is happening here all the time. What about the yuan? The eastern dragon will spew money in ’25 like Daenerys Targaryen’s dragons spewed flames. Lots of money, lots of fire. Amidst the crisis in the CCP of the PRC, Comrade Xi will privatize Taiwan, again lots of fire. Lots of sanctions again. A weak yuan. Expensive chips. A recovering ruble. Why? Because there’s a lot more meat in a dragon than in a bear, and there’s a lot of hungry people running around with pitchforks.
We need to upgrade the processor. Do it in ’24. Hello!
This release was prepared with the direct participation of analysts from trading platforms eOil.ru and IDK.ru. Here is an assessment of the situation on the global and Russian markets.
Amid concerns about the lack of moisture in the fields for quality winter sowing, Russian wheat prices have started to rise, gradually narrowing the gap with European wheat prices. Prices are rising mostly FOB, having rebounded from 210 and now stand at 228 per ton, (12.5% protein).
At EXW, stabilization is more likely. The dynamics of growth is still poorly tracked. Individual spurts from week to week can hardly be considered a trend. So far the 4th class in the Volga region is at the level of 12800 per ton and thanks to that. What draws attention is the 5th class, which does not want to fall and there is no question of 7000 or even 5000 per ton, as a year ago. Let’s give 10000 rubles.
We now have a new fetish for meat, specifically pork. And if that’s the case, we need a lot of fodder. Better yet, we should be concerned about the dairy herd. The problem is 110 years old, since 1913. Even communists could not saturate the state with milk, Finns could, but where they were then and where they are now. On the counter, a piece of what is considered butter costs 260 rubles for 180 grams (it is convenient to translate it into dollars nowadays).
They’ll take our grain. No doubt about it. Especially with the weakening ruble, poor states will contract it. Egypt took 1.4 million tons in September, good for them. And you barter us coral fish and pyramids. Let’s give everyone a pharaoh in the barn, but not in the hall to put this junk. Even if it’s a souvenir. Or a magnet, without the pharaoh. That’s also an option.
Energy market:
The fashion for using armies, or gangs, whoever has what… is gaining momentum. It’s making the oil sector stormy. No one can predict anything ahead, everyone lives in the same day, always looking around for someone coming from behind. Such is our glorious world.
Until Israel’s froth subsides, we will see the oil market toned down. The fascination with emptying useless Cold War arsenals is also on trend. The Pentagon will clearly continue to unload its own deposits while helping Israel fight an invisible enemy. The battle with the genies is like that, it can be fought for a very long time. You can just shoot the fish, the one in the sea. And the effect, and the noise, and the rumble, and the confident American voters. And oil at 80.00. It could be 60.00. Moscow is not worse off, so you can go on, go on, go on figuring out who really should be worshipped there. Everything is the same as it was 1,000 years ago. The form changes, but not the content.
USD/RUB:
“Give us 50% odds!” we wrote last week. Yes, it was not a joke at all, there are some probabilities in this gloomy direction, but one should not take everything so literally. The ruble has been weakening 1% a day all week against the backdrop of the militaristic budget, which brings to mind the continuation of inflation and the Central Bank’s struggle with the growing ruble mass, which has nowhere to go. There is a lot of money — not enough goods. In fact, we will reach the rate of 50%.
In the meantime, we have a 20% rate on the table. This is a very bad level, an indicator, if you like. If the Central Bank rate in your country is 20%, it means that inflation is rising and things are not very good. And already in the next act of the play, the ship may tilt very badly on one side. A little more and stagflation, and then… then there is a real risk of hyperinflation as in Argentina or Turkey.
We are likely to stand at 96.00 for some time, but this level is likely to be overcome. We are going to 100.00 on dollar/ruble pair. Further we will try to pass to 104 rubles per 1 dollar.
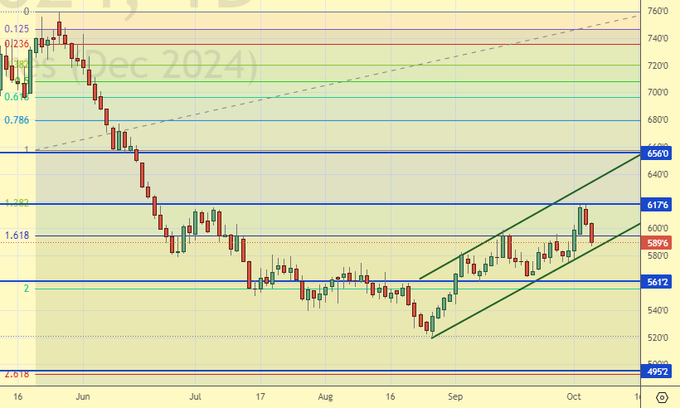
Wheat No. 2 Soft Red. CME Group
Let’s look at the volumes of open interest in Wheat. You should take into account that this is three days old data (for Tuesday of last week), but it is also the most recent data published by CME Group.
At the moment there are more open short positions of asset managers than long ones. Over the past week the difference between long and short positions of asset managers decreased by 5.6 th. contracts. There were no buyers, sellers were reducing their positions. Bears maintain control.
Growth scenario: we consider December futures, expiration date December 13. On downward pullbacks it is possible to buy. Those who wish can do it right now. Note that the risk of price drop to 500.0 remains.
Downside scenario: we need levels above the current levels to sell. We want 656.0.
Recommendations for the wheat market:
Purchase: when approaching 500.0. Stop: 490.0. Target: 650.0. Or now (589.6). Stop: 577.0. Target: 656.0.
Sell: on approach to 650.0. Stop: 675.0. Target: 540.0.
Support — 561.2. Resistance — 617.6.
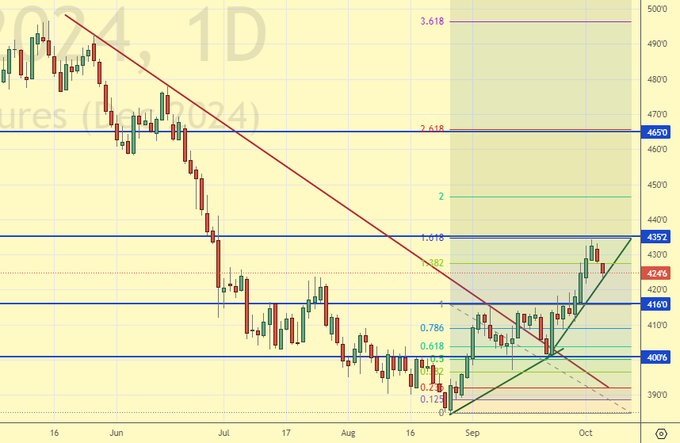
Corn No. 2 Yellow. CME Group
Let’s look at the volumes of open interest in Corn. You should take into account that this data is three days old (for Tuesday of last week), it is also the most recent of those published by the CME Group exchange.
At the moment there are more open short positions of asset managers than long ones. Over the past week the difference between long and short positions of asset managers decreased by 68.2 thousand contracts. The change is significant. Buyers entered the market, but the main thing is that sellers left the market en masse. Bears are still controlling the situation.
Growth scenario: we consider December futures, expiration date December 13. We are at 435.0. Then we will pullback to 410.0 — 416.0 and continue the growth.
Downside scenario: need higher levels to sell. For example: 465.0.
Recommendations for the corn market:
Purchase: when approaching 410.0. Stop: 398.0. Target: 465.0.
Sell: thinking when approaching 465.0.
Support — 416.0. Resistance — 435.2.
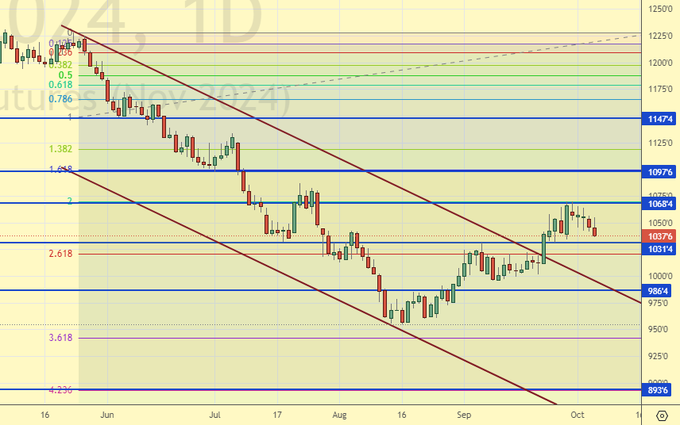
Soybeans No. 1. CME Group
Growth scenario: we consider November futures, expiration date November 14. We are not thinking about buying yet. There are a lot of soybeans.
Downside scenario: we will sell from 1095.0. But! We should not miss the current situation. We enter short at current prices.
Recommendations for the soybean market:
Purchase: when approaching 850.0. Stop: 830.0. Target: 1100.0.
Sell: when approaching 1095.0. Stop: 1107. Target: 850.0. Or now (1037.6.) Stop: 1058.0. Target: 850.0.
Support — 1031.4. Resistance — 1068.4.
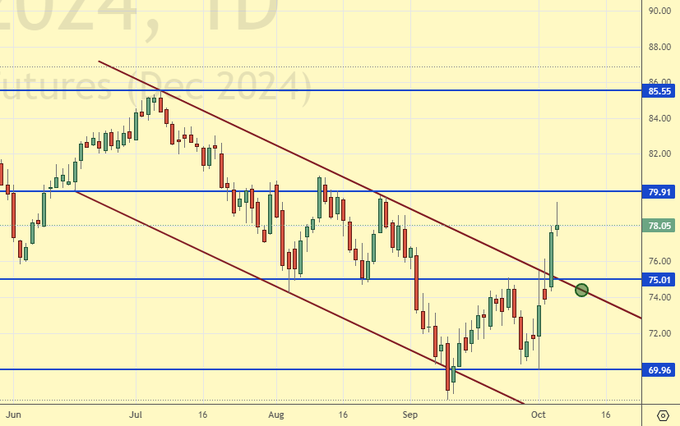
Brent. ICE
Let’s look at the open interest volumes for Brent. You should take into account that this is three days old data (for Tuesday of last week), and it is also the most recent data published by the ICE exchange.
At the moment there are more open long positions of asset managers than short ones. During the past week the difference between long and short positions of asset managers grew by 21.3 th. contracts. Buyers entered the market, sellers left it in approximately equal volumes. Bulls regained their control over the market.
Growth scenario: moved to December futures, expiration date October 31. Buying in this situation is not interesting. We need a pullback down.
Downside scenario: came out of the falling channel upwards. Out of the market.
Recommendations for the Brent oil market:
Purchase: no.
Sale: no.
Support — 75.01. Resistance — 79.91.
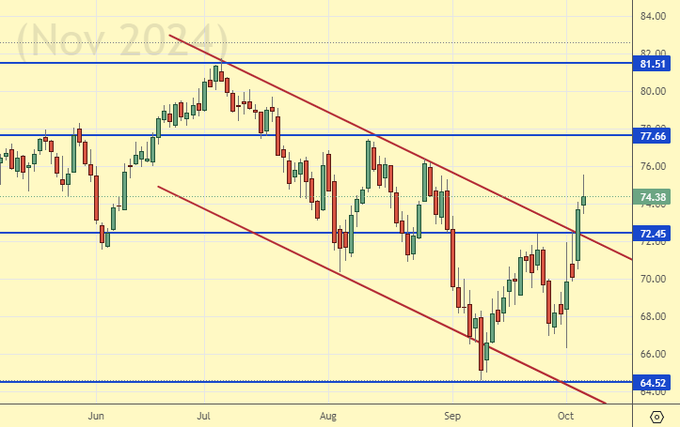
WTI. CME Group
US fundamentals: the number of active rigs decreased by 5 to 479.
US commercial oil inventories rose by 3.889 to 416.931 million barrels, with -1.5 million barrels forecast. Gasoline stocks rose by 1.119 to 221.202 million barrels. Distillate stocks fell -1.284 to 121.637 million barrels. Cushing storage stocks rose by 0.84 to 23.667 million barrels.
Oil production increased by 0.1 to 13.3 million barrels per day. Oil imports increased by 0.172 to 6.628 million barrels per day. Oil exports fell by -0.019 to 3.878 million barrels per day. Thus, net oil imports rose by 0.191 to 2.75 million barrels per day. Oil refining fell by -3.3 to 87.6 percent.
Gasoline demand fell -0.684 to 8.521 million barrels per day. Gasoline production fell -0.235 to 9.602 million barrels per day. Gasoline imports fell -0.206 to 0.54 million barrels per day. Gasoline exports rose -0.115 to 0.962 million barrels per day.
Distillate demand fell -0.384 to 3.638 million barrels. Distillate production fell by -0.104 to 4.794 million barrels. Distillate imports rose -0.092 to 0.194 million barrels. Distillate exports rose 0.237 to 1.534 million barrels per day.
Demand for petroleum products fell by -1.539 to 19.847 million barrels. Petroleum products production fell by -0.532 to 21.592 million barrels. Imports of refined petroleum products rose 0.184 to 1.589 million barrels. Exports of refined products rose by 0.406 to 7.168 million barrels per day.
Propane demand fell -0.453 to 0.879 million barrels. Propane production rose by 0.015 to 2.687 million barrels. Propane imports fell -0.017 to 0.086 million barrels. Propane exports rose 0.193 to 1.857 million barrels per day.
Let’s look at the WTI open interest volumes. You should take into account that this is three-day old data (for Tuesday of last week), and it is also the most recent data published by the CME Group exchange.
At the moment there are more open long positions of asset managers than short ones. During the past week the difference between long and short positions of asset managers decreased by 22.2 th. contracts. Buyers were leaving the market. Sellers were actively entering. Bulls keep control.
Growth scenario: we consider November futures, expiration date October 22. We need a pullback to buy. So far out of the market.
Downside scenario: came out of the falling channel upwards. Out of the market.
Recommendations for WTI crude oil:
Purchase: no.
Sale: no.
Support — 72.45. Resistance — 77.66.
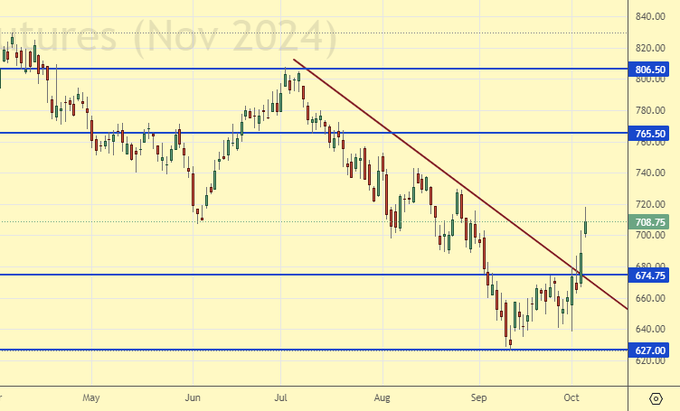
Gas-Oil. ICE
Growth scenario: moved to November futures, expiration date November 12. Purchases in this situation will be interesting after a downward pullback. So far out of the market.
Downside scenario: it will be interesting to sell from 765.0. If the market really grows so significantly, it is possible to enter short.
Gasoil Recommendations:
Purchase: no.
Sell: on approach to 765.0. Stop: 785.00. Target: 505.00.
Support — 674.75. Resistance — 765.50.
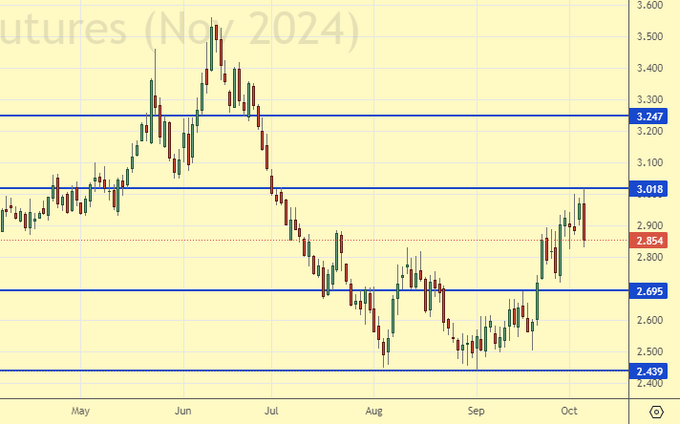
Natural Gas. CME Group
Growth scenario: we consider November futures, expiration date is October 29. We continue to hold longs. The target at 3.190 seems interesting on the eve of winter.
Downside scenario: nothing interesting. Off-market.
Natural Gas Recommendations:
Purchase: no. Those who are in position from 2.480 move the stop to 2.690. Target: 3.190 (3.600).
Sale: no.
Support — 2.695. Resistance — 3.018.
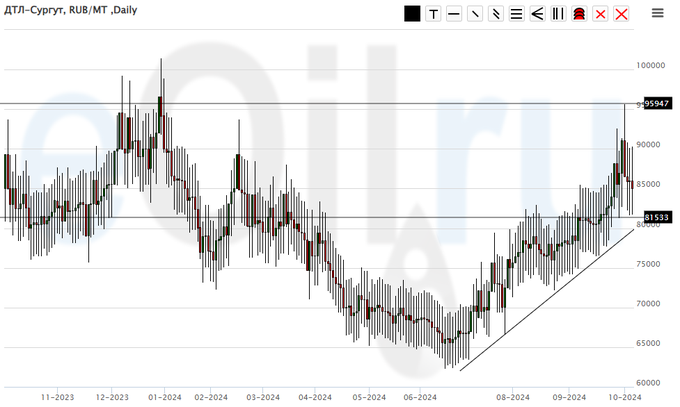
Diesel arctic fuel, ETP eOil.ru
Growth scenario: we will keep longing. Chances for growth are not bad.
Downside scenario: we won’t sell as we can’t believe there is no need for diesel right now.
Diesel Market Recommendations:
Purchase: No. Those in position from 65000, move your stop to 75000. Target: 100000!
Sale: no.
Support — 81533. Resistance — 95947.
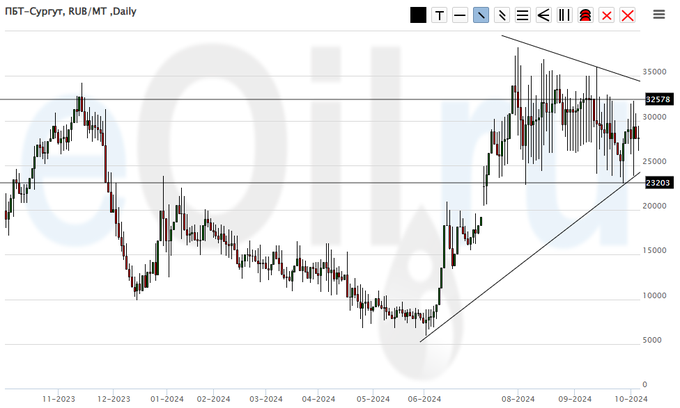
Propane butane (Surgut), ETP eOil.ru
Growth scenario: continuation of growth from current levels is not excluded. A pullback to 20000 is needed for good purchases. Waiting.
Downside scenario: we will not sell, there is a risk of further price growth.
PBT Market Recommendations:
Purchase: at touching 20000. Stop: 17000. Target: 40000.
Sale: no.
Support — 23203. Resistance — 32578.
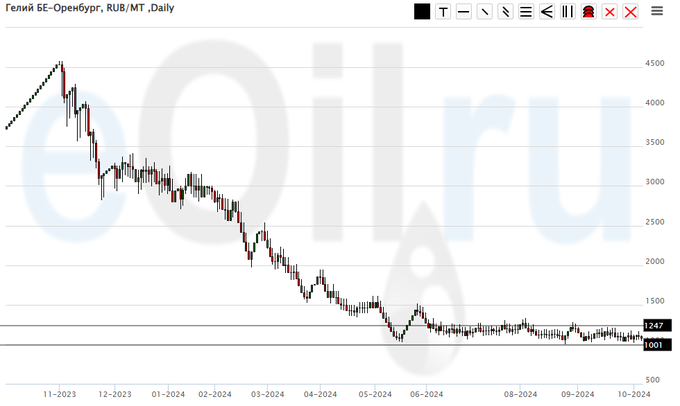
Helium (Orenburg), ETP eOil.ru
Growth scenario: we see stagnation. Outside the market.
Downside scenario: stay out of the market, prices are low.
Helium market recommendations:
Purchase: no.
Sale: no.
Support — 1001. Resistance — 1247.
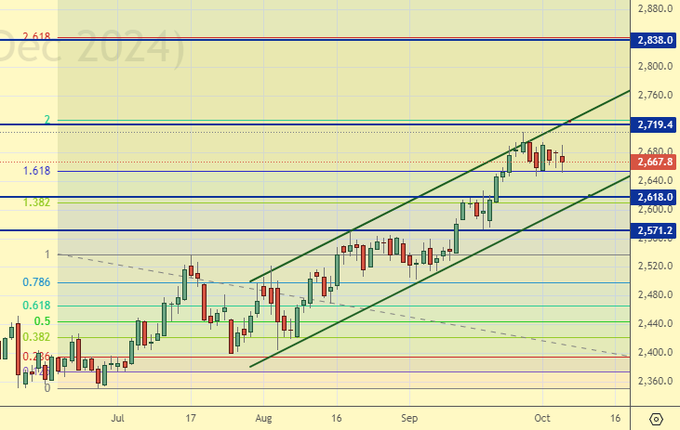
Growth scenario: we consider the December futures, expiration date December 27. We need now a correction to 2570, better to 2550. It will be possible to buy there, if before this correction there will be no touch of 2719 at the beginning.
Downside scenario: shorting from 2720 will be interesting.
Gold Market Recommendations:
Purchase: until touching 2719 on a pullback to 2570 (2550). Stop: 2530. Target: 2720.
Sell: on approach to 2720. Stop: 2740. Target: 2200?!
Support — 2618. Resistance — 2719.
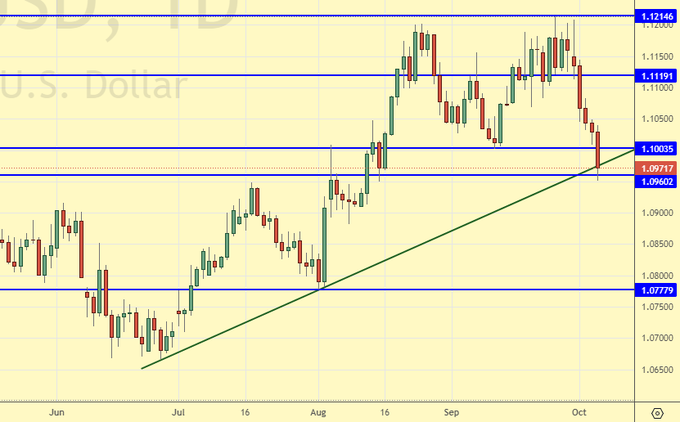
EUR/USD
Growth scenario: it is possible to buy now. Fundamentally it is not very reasonable, but technically the levels are very attractive.
Downside scenario: went down 2 figures during the week. If we return to 1.1111, we will sell.
Recommendations on euro/dollar pair:
Purchase: now (1.0971). Stop: 1.0938. Target: 1.1600?
Sell: on a rise to 1.1111. Stop: 1.1141. Target: 1.0000.
Support — 1.0960 (1.0777). Resistance — 1.1003.
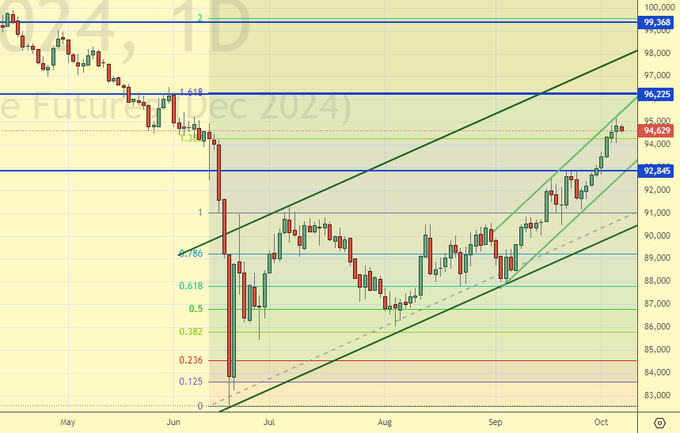
USD/RUB
Growth scenario: we consider December futures, expiration date December 19. Nothing new. The market is able to go higher. We hold the long.
Downside scenario: no interesting ideas for sales. Out of the market.
Recommendations on dollar/ruble pair:
Purchase: No. Those who are in position from 85976, move your stop to 93900. Target: 100000 (200000. Yes, yes, it is possible).
Sale: no.
Support — 92845. Resistance — 96225.
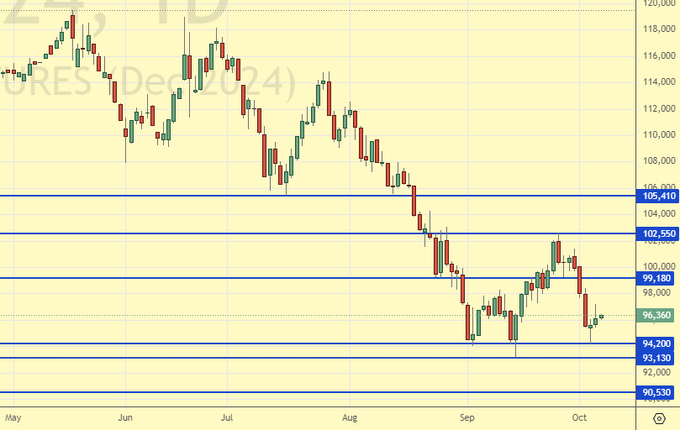
RTSI. MOEX
Growth scenario: we consider December futures, expiration date December 19. We will buy when approaching 90600. Failure under 90600 will lead to panic dumping of shares.
Downside scenario: if the market gives, the entry to short from 105000 will be ideal. Taking into account the negative external background we have to work out the level of 100000.
Recommendations on the RTS index:
Purchase: when approaching 90600. Stop: 90300. Target: 105000.
Sell: on approach to 100000. Stop: 101300. Target: 90600.
Support — 94200. Resistance — 99180.
The recommendations in this article are NOT a direct guide for speculators and investors. All ideas and options for working on the markets presented in this material do NOT have 100% probability of execution in the future. The site does not take any responsibility for the results of deals.
|
|
|