Price forecast from 17 to 21 January 2022
Grain market:
The main thing is that friction along the Russia-NATO line does not start to spark and give off unnecessary heat to anyone.
Good day to all!
The January USDA report did not make much of an impression on traders. Data on the gross harvest of wheat and corn came out almost unchanged. It is possible that in January Argentina and Brazil will receive less moisture due to the La Niña effect and this will create problems for corn and soybeans, but on a global scale, the drop in volumes will not be strong. Passion for the «omicron» has faded into the background as the disease is more easily tolerated than in the case of the original COVID-19 virus.
The fear of possible lockdowns has left the market, which will allow prices to decline slightly in the future, however, we do not expect the grain market to return to the levels of 2019, even against the backdrop of a good harvest in 2022, as the US Federal Reserve, apparently, decided smoothly devalue the dollar.
Energy market:
The oil market reacts quite nervously to inflation in the US. Price growth of 7% per annum is officially recognized, which is the maximum in almost 40 years. At the same time, Fed officials, although they are talking about three rate hikes in 2022, have not yet come to the point, and it is not clear when it will come. Maybe in March, or maybe we’ll have to wait again.
Meanwhile, Biden is already distributing newly printed $2 trillion. 620 billion for bridges and roads, the rest will go to schools, research, some industry and care for the elderly. All due to the growth of taxes on the rich, which will need to be raised, and then also collected. Against such a background, the dollar will obviously be in a fever, and commodity prices will rise at every opportunity.
Gas prices in Europe continue to be at the level of $1,000 per 1,000 cubic meters. American LNG ships are unable to smooth over the problem. Russia is not yet in a hurry to increase supply, which is why the market began to have a gloomy realization that Europe will not survive the winter of 2023 in peace. One way or another, we will have to negotiate with Moscow.
USD/RUB:
The ruble has struggled and experienced mild horror last week over the failure of talks between Russia and the Western world. Now we are waiting for a public written response from the United States to Russia’s demands to return NATO troops to the 1997 line and not to accept new members into the bloc. After the answer is published, the ruble will go to the level of 80.00, and where the RTS index will go is even hard to imagine.
Market volatility has risen sharply, while the Ministry of Finance of the Russian Federation will continue to buy foreign currency guided by the budget rule. From January 14 to February 4, 585.9 billion rubles will be thrown into the market. Our value judgment: in the current situation, it would be possible to look for a use for rubles within our own economy, and not store dollars and euros in the basement or on a computer hard drive.
What is the point of drowning the already weakening ruble? A modest attempt to analyze the current situation leads to the appearance of paintings by Salvador Dali. At this rate, the predictions of a number of black analysts who see a dollar at 125 rubles in their dreams will come true.
Wheat No. 2 Soft Red. CME Group
We’re looking at the volume of open interest of wheat managers. You should keep in your mind that these are data from three days ago (for Tuesday of the past week), they are also the most recent of those published by the CME Group.
Over the past week, the difference between long and short positions of managers increased by 8.5 thousand contracts, while there are more sellers on the market than buyers.
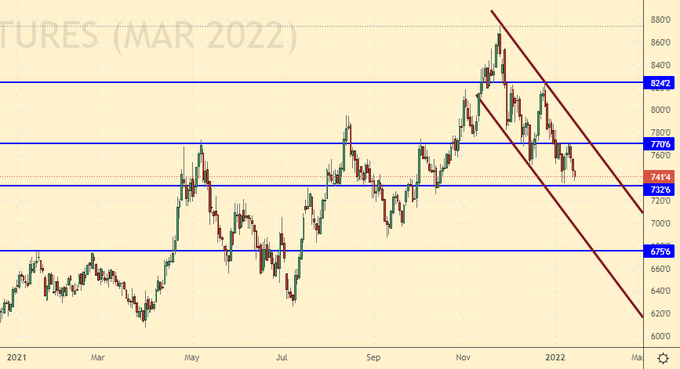
Growth scenario: March futures, the expiration date is March 14. There is a threat of a passage below the level of 730.0. If that happens, we might end up at 675.0. We keep the open long. We are not opening new positions.
Falling scenario: we will not sell. The levels are not favorable for short entry.
Recommendation:
Purchase: no. Who is in position from 735.0, keep the stop at 710.0. Target: 1180.0?!
Sale: no.
Support — 732.6. Resistance — 770.6.
We are looking at the volumes of open interest of corn managers. You should take into account that this is data from three days ago (for Tuesday of the last week), it is also the most recent one that is published by the CME Group exchange.
Over the past week, the difference between long and short positions of managers has decreased by 20.6 thousand contracts, while there are more bulls in the market than bears.
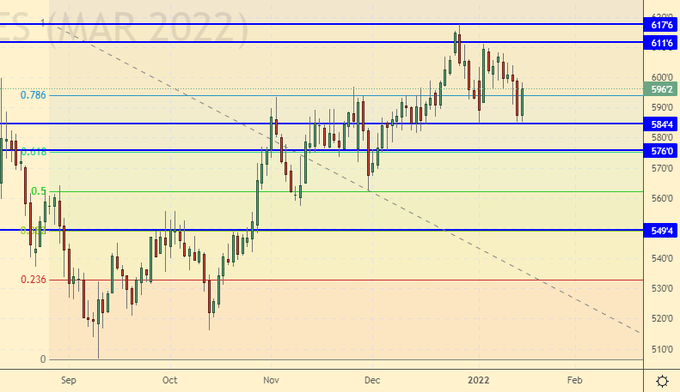
Growth scenario: March futures, the expiration date is March 14. The current correction has a risk of developing to 550.0. If this happens, then it is obligatory to buy from 550.0.
Falling scenario: You should have sold at the end of the trading day on Monday. Now it is worth holding the previously open shorts. We are not opening new positions.
Recommendation:
Purchase: when approaching 550.0. Stop: 530.0. Target: 665.0.
Sale: no. Who is in position from 600.0, keep the stop at 612.0. Target: 555.0.
Support — 584.4. Resistance — 611.6.
Soybeans No. 1. CME Group
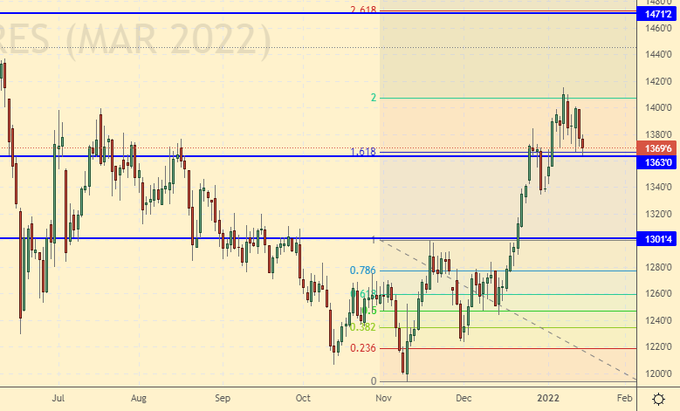
Growth scenario: March futures, the expiration date is March 14. We continue to hold longs. We expect the market to reach the level of 1470.
Falling scenario: still out of the market. We will sell from 1470. Recommendation:
Purchase: no. Who is in position from 1267.0 and 1280.0 keep stop at 1320.0. Target: 1468.0.
Sale: when approaching 1470. Stop: 1490. Target: 1360.
Support — 1363.0. Resistance — 1471.2.
Sugar 11 white, ICE
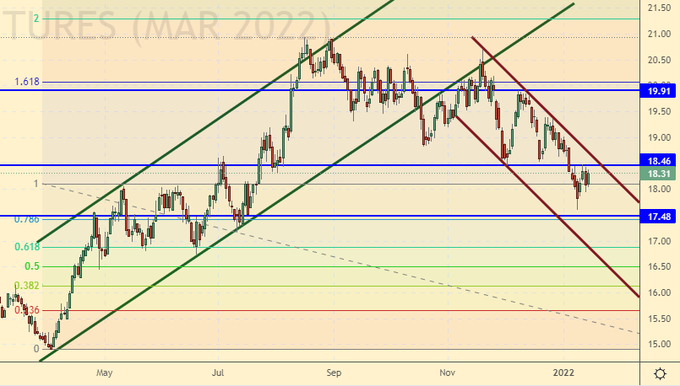
Growth scenario: March futures, the expiration date is February 28. You should have bought at the approach to 17.50. Now, we hold longs, we expect a return to the level of 20.00, we may go even higher.
Falling scenario: if we find ourselves around 20.00 again, we will think about shorts.
Recommendation:
Purchase: no. Who is in position from 17.65, keep the stop at 17.20. Target: 23.20.
Sale: think when approaching 20.00.
Support — 17.48. Resistance — 18.46.
Сoffee С, ICE
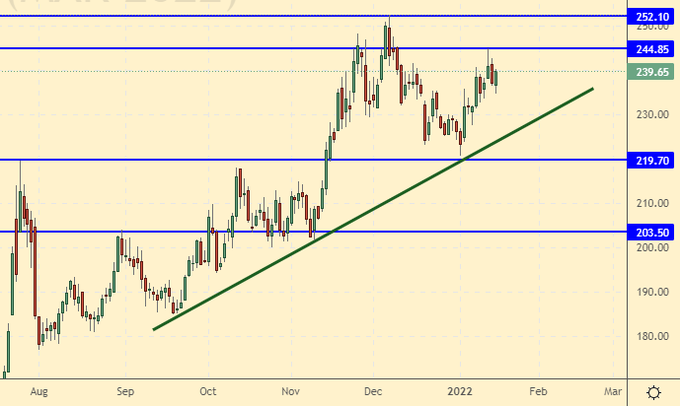
Growth scenario: March futures, the expiration date is March 21. For purchases, we need a drop to the 200.0 area. While out of the market.
Falling scenario: keep short positions. We are waiting for a move to 200.0. If you haven’t logged in before, you can do so now.
Recommendation:
Purchase: think when approaching 200.0.
Sale: now. Stop: 246.0 Target: 200.0. Who is in position from 245.0, keep the stop at 246.0. Target: 200.0.
Support — 219.70. Resistance is 244.85.
Brent. ICE
We’re looking at the volume of open interest of Brent managers. You should keep in your mind that these are data from three days ago (for Tuesday of the past week), they are also the most recent of those published by the ICE exchange.
Over the past week, the difference between long and short positions of managers increased by 44.4 thousand contracts. The bulls are in complete control of the market.
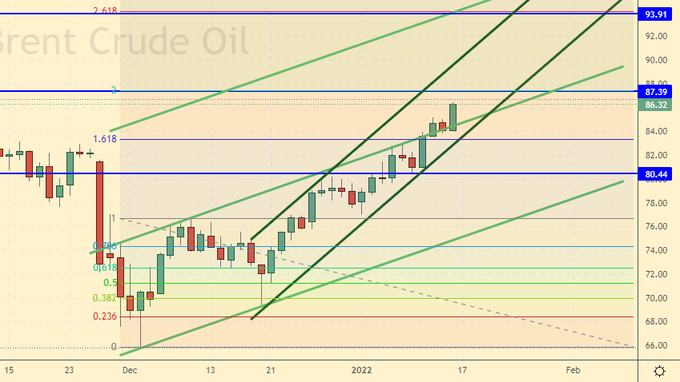
Growth scenario: January futures, the expiration date is January 31. The mark 93.90 has opened at the top. We will count on a touch of 87.30, after which a rollback to 82.50 should follow, and only then the growth will continue.
Falling scenario: from 93.90 we will definitely sell. Short from 87.30 is better to work out on the «hours».
Recommendation:
Purchase: when approaching 82.50. Stop: 81.00. Target: 93.90.
Sale: when approaching 93.90. Stop: 96.90. Target: 84.00.
Support — 80.44. Resistance — 87.39.
WTI. CME Group
Fundamental US data: the number of active drilling rigs increased by 11 units and now stands at 492 units.
US commercial oil inventories fell by -4.553 to 413.298 million barrels, while the forecast was -1.904 million barrels. Inventories of gasoline rose by 7.961 to 240.748 million barrels. Distillate inventories rose by 2.537 to 129.383 million barrels. Inventories at Cushing fell -2.468 to 34.838 million barrels.
Oil production fell by -0.1 to 11.7 million barrels per day. Oil imports rose by 0.185 to 6.069 million barrels per day. Oil exports fell -0.599 to 1.955 million bpd. Thus, net oil imports increased by 0.784 to 4.114 million barrels per day. Oil refining fell by -1.4 to 88.4 percent.
Gasoline demand fell by -0.266 to 7.906 million barrels per day. Gasoline production increased by 0.068 to 8.574 million barrels per day. Gasoline imports fell by -0.007 to 0.589 million barrels per day. Gasoline exports rose by 0.056 to 0.526 million barrels per day.
Demand for distillates rose by 0.01 to 3.749 million barrels. Distillate production fell -0.177 to 4.788 million barrels. Distillate imports fell -0.001 to 0.216 million barrels. Exports of distillates rose by 0.081 to 0.892 million barrels per day.
Demand for petroleum products rose by 1.164 to 20.829 million barrels. Production of petroleum products increased by 1.449 to 21.774 million barrels. Imports of petroleum products increased by 0.167 to 1.845 million barrels. The export of oil products increased by 0.604 to 4.665 million barrels per day.
Propane demand fell by -0.181 to 1.564 million barrels. Propane production increased by 0.046 to 2.418 million barrels. Propane imports rose by 0.016 to 0.135 million barrels. Propane exports rose by 0.616 to 1.467 million barrels per day.
We’re looking at the volume of open interest of WTI managers. You should keep in your mind that these are data from three days ago (for Tuesday of the past week), they are also the most recent of those published by the ICE.
Last week the difference between long and short positions of managers increased by 25.3 thousand contracts. The sellers entered the market, however, the outcome of the sellers was much more striking. Buyers push the market up.
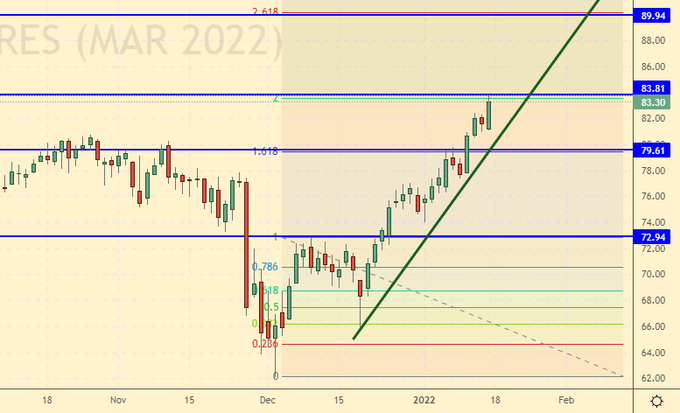
Growth scenario: March futures, the expiration date is February 22. We continue to count on a rollback to the 75.00 area. There is no denying a move to 89.90 without a correction, but this does not happen often.
Falling scenario: the current levels are interesting for the short, but given the nervousness in international affairs, we recommend that this short be worked out on the 1H.
Recommendation:
Purchase: when falling to 75.00. Stop: 71.40. Target: 89.90.
Sale: when approaching 89.90. Stop: 92.60. Target: 80.20.
Support — 79.61. Resistance — 83.81.
Gas-Oil. ICE
Growth scenario: February futures, the expiration date is February 10. Would like to see a rollback. We don’t buy.
Falling scenario: short from current levels is possible, but it is better to work it out on the hourly. Recommendation:
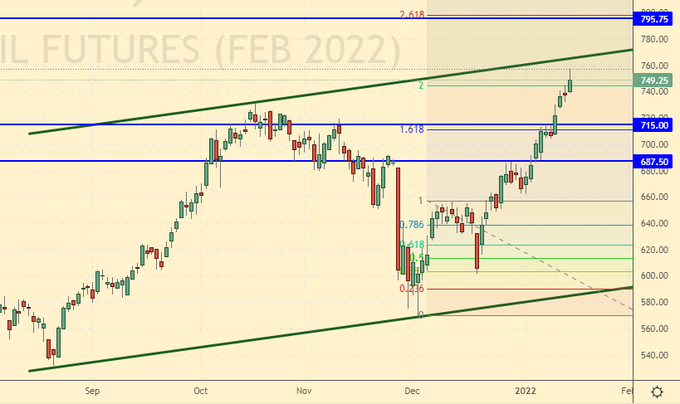
Purchase: on a rollback to 690.0. Stop: 670.0. Target: 795.0.
Sale: when approaching 795.0. Stop: 825.00. Target: 720.00.
Support — 715.00. Resistance is 795.75.
Natural Gas. CME Group
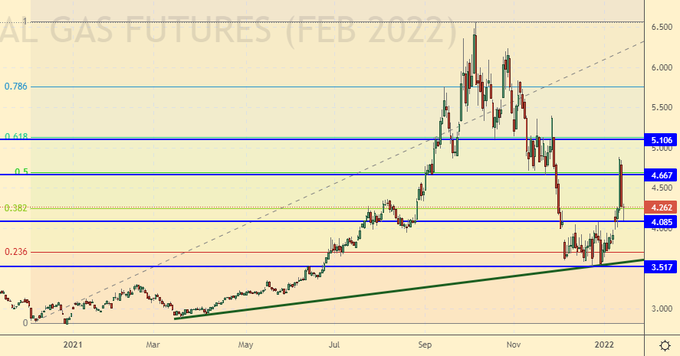
Growth scenario: February futures, the expiration date is January 27th. We recommended buying around 3.700, now we just keep long. In the US, there were frosts under -30 Celsius.
Falling scenario: do not sell. February is still ahead of us. After that, it will be clear what to do next. Europe will end up with empty gas storages. They will buy everything and everyone.
Recommendation:
Purchase: no. Who is in position between 3.600 and 3.700, move the stop to 3.400. Target: 8.777.
Sale: no.
Support — 4.085. Resistance — 5.106.
Gold. CME Group
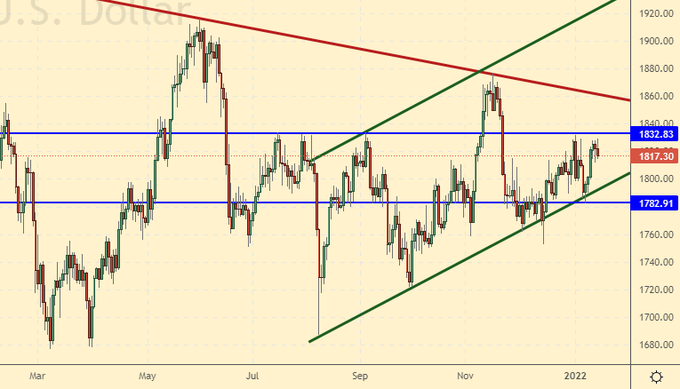
Growth scenario: we continue to hold longs. As long as the market is above 1800, nothing threatens the bulls.
Falling scenario: shorting gold will be possible after falling below 1770 while out of the market. Recommendations:
Purchase: no. Who is in position from 1780, keep the stop at 1770. Target: 2300.
Sale: think after falling below 1770.
Support — 1782. Resistance — 1832.
EUR/USD
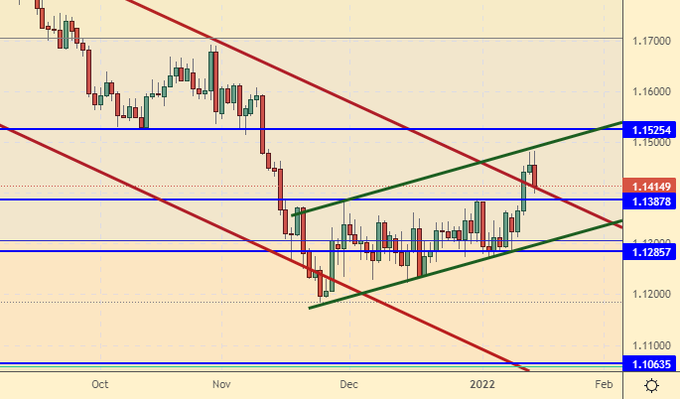
Growth scenario: the pair tried to touch 1.1500, which fits into the theory of visiting the level of 1.1070, but in case of a pass above 1.1600, bulls will come to the market.
Falling scenario: if we return under 1.1300, then on hourly intervals it will be possible to work out shorts to 1.1070.
Recommendations:
Purchase: when approaching 1.1070. Stop: 1.1020. Target: 1.2100. Think after rising above 1.1600. Sale: no.
Support — 1.1387. Resistance is 1.1525.
USD/RUB
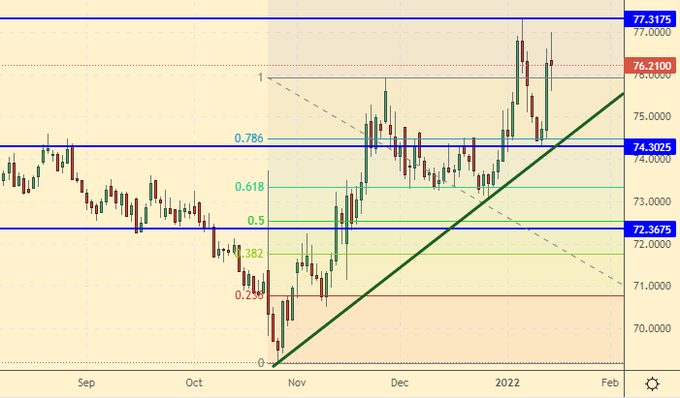
Growth scenario: it is not yet clear what will cause the market to turn down. We continue shopping. Those who wish can increase previously opened longs. Consider the high volatility in the market. Count the risks.
Falling scenario: to sell dollars, you need positive signals for the ruble. We are waiting for Washington’s public refusal of Moscow’s demands to move military bases away from the borders and stop NATO expansion. And besides, the Ministry of Finance will continue to buy dollars from the market. So we don’t have any positives. And if so, then there are no recommendations to sell the dollar.
Recommendations:
Purchase: now. Stop: 73.10. Target: 82.00. Who is in position from 75.20 and 74.30, keep the stop at 73.10. In case of a sharp puncture to 72.00, the Central Bank may try to punish speculators by buying aggressively, but before that, carefully analyze the current news background.
Sale: no.
Support — 74.30. Resistance is 77.31.
RTSI
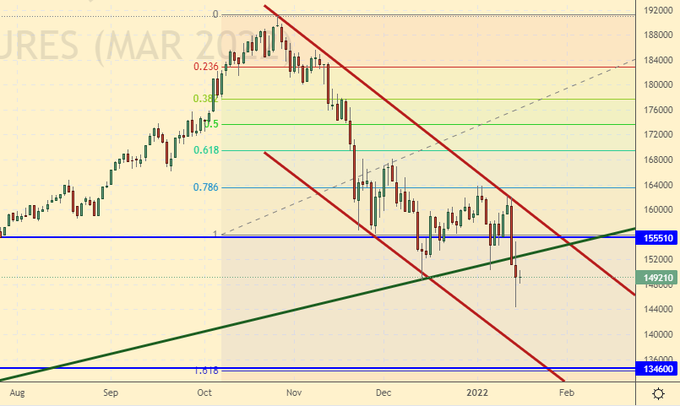
Growth scenario: there is no growth scenario now and cannot be. Sberbank was beaten with sticks last week, with many investors weeping as they looked at the fading funds in a brokerage account. Technical purchases in shares on Friday somewhat smoothed the picture by the end of the week, but what is happening looks like a funeral for the market with targets for the RTS index at 100,000, and possibly even 80,000, if you’re not lucky at all. We don’t buy.
Falling scenario: what will Moscow do after it is denied agency for the whole world next week, that is the question. And no one has an answer. Let’s hope that the strategists who started the story with a public ultimatum to the West in December have it. And since the plans of the government are not known to us, we look at the technical picture, and there are only shorts on it. So we will sell.
Recommendations:
Purchase: no.
Sale: now. Stop: 166000. Target: 105000 (80000). Count the risks.
Support — 134600. Resistance — 155510.
The recommendations in this article are NOT a direct guide for speculators and investors. All ideas and options for working on the markets presented in this material do NOT have 100% probability of execution in the future. The site does not take any responsibility for the results of deals.
