
22.12
|
||||||||
|
< | Декабрь | > | < | 2024 | > |
| пн | вт | ср | чт | пт | сб | вс |
|---|---|---|---|---|---|---|
| 1 | ||||||
| 2 | 3 | 4 | 5 | 6 | 7 | 8 |
| 9 | 10 | 11 | 12 | 13 | 14 | 15 |
| 16 | 17 | 18 | 19 | 20 | 21 | 22 |
| 23 | 24 | 25 | 26 | 27 | 28 | 29 |
| 30 | 31 | |||||
Grain market:
At a time when trading instruments on MICEX are shrinking, we should think about whether we need all these quotes so much. For example, if you go to RosKOOOPtorg in 2028 and see: horns 3 rubles. 45 kop., hooves 2 rub. 14 kopecks. And it’s normal. And stable. And no price fluctuations. No, perhaps we should leave some market instruments. Otherwise there will be nothing but horns and hooves on the shelves.
Here’s to entrepreneurship, here’s to commerce, here’s to the balance between supply and demand!!!! Hello!
This release was prepared with the direct participation of analysts from trading platforms eOil.ru and IDK.ru. Here is an assessment of the situation on the global and Russian markets.
The USDA gross harvest report came out. It was more of a surprise than not. Wheat was promised as much as 796.2 million tons (+0.69% compared to June), despite the fall of the gross harvest in Russia to 83 million tons (this, by the way, is by 8.5 million tons less than last season). As for the EU, we can say that it is a surprise, and a positive one. There were cries that everything was bad in France, but it did not affect the whole continent, they plan to harvest exactly 130 million tons.
What we have at the moment in wheat: growing appetite from importers, otherwise ending stocks would not fall from year to year with increasing supply, which gives confidence that even despite the excellent harvest prices are unlikely to be driven to the bottom (up to 450 cents per bushel). We are more likely to touch 500.0 and slowly move up. We won’t see $200/ton at FOB, but we might see $210 some day. In fact, the crop is already formed, harvesting is underway, its intensity will increase in the coming weeks, which will keep prices at the minimum level, but from the beginning of September we will see a move up, and perhaps even earlier, after the end of the Olympics in France.
Corn also looks good. The growth of gross harvest by 0.35% to 1224.8 allows us to say that there are no risks in this crop. Soybean: 421.9 million tons is an excellent volume, which is 26 million tons more than last season.
Energy market:
So, we have another OPEC report in hand. We see that the cartel increased oil supplies by sea to 21 mb/d, adding 0.9 mb/d compared to May. At the same time, we have a physical supply deficit throughout the first half of the year, which has now widened to 1.6 mb/d in the second quarter from 1.3 mb/d in the first quarter. This means that storage facilities should be emptying, which lays a time bomb for oil prices, especially as demand will continue to grow in Q3.
The increase in US oil production to a record 13.3 million barrels will not save the Americans. Reserves continue to melt and it is already evident that the Biden administration is slowly but surely moving into the mode: we would like to get through the day and make it through the night. Commercial reserves at 445 million barrels is a very uncomfortable story. It is still bearable for traders, but if we see a drop below 400, and the trend is downward now, we can expect a more painful price reaction to the release of inventory statistics every Wednesday.
USD/RUB:
If we stop trading in yuan, then, well… we will be oriented towards the interbank market. In any case, as long as we have exports and payment for them, Russia is much stronger and more elastic in the current market model than under communists, where everything happens just one day. Just «crunch», and there is no economy. And so we can still try.
We continue to note that the ruble could strengthen on a possible misalignment when there is too much currency within the country. And the government does not want that, by the way. It is not for nothing that they have lowered the norm for selling foreign currency earnings again: now from 60% to 40%. But it may happen that companies will simply need rubles and will sell foreign currency (sorry, fiat currencies) at any price, for example, to pay taxes. If it’s 75 rubles per dollar, you can buy an American. And the fact that they are shooting at presidential candidates, that’s their popular pastime. Don’t pay attention.
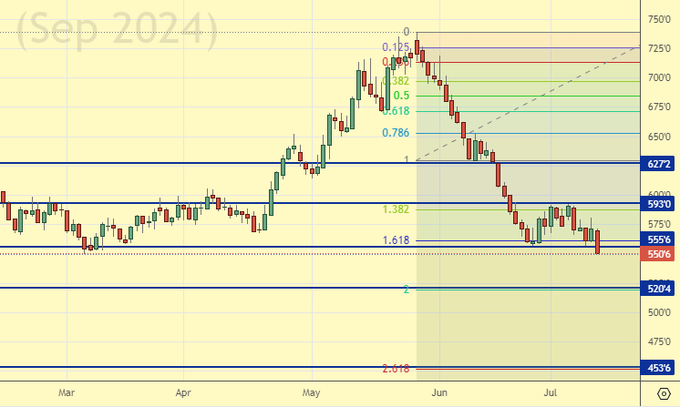
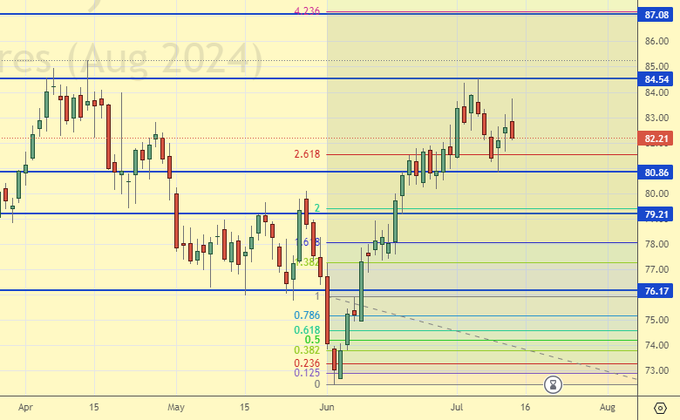
Wheat No. 2 Soft Red. CME Group
Let’s look at the volumes of open interest in Wheat. You should take into account that this is three days old data (for Tuesday of last week), but it is also the most recent data published by CME Group.
At the moment there are more open short positions of asset managers than long ones. During the past week the difference between long and short positions of asset managers decreased by 0.1 th. contracts. Both buyers and sellers entered the market in insignificant volumes. Bears keep control.
Growth scenario: we consider September futures, expiration date September 13. We refrain from buying for now. It is better to enter the long from 520 on the hours.
Downside scenario: without upward correction, medium-term sales are not safe. Outside the market.
Recommendations for the wheat market:
Buy: no.
Sell: thinking when approaching 625.0.
Support — 520.4. Resistance — 593.0.
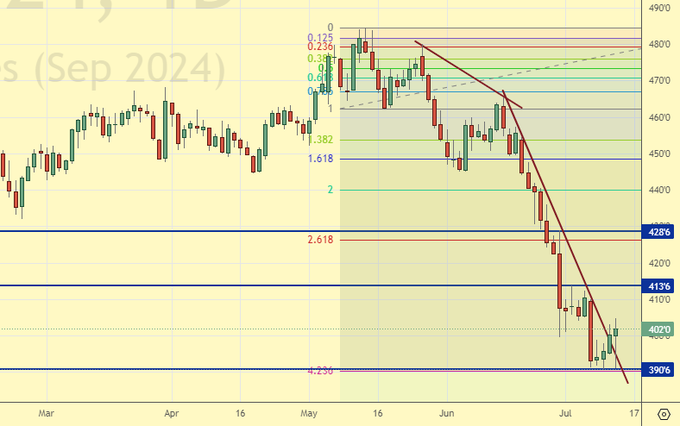
Corn No. 2 Yellow. CME Group
Let’s look at the volumes of open interest in Corn. You should take into account that this data is three days old (for Tuesday of last week), it is also the most recent of those published by the CME Group exchange.
At the moment there are more open short positions of asset managers than long ones. During the past week the difference between long and short positions of asset managers increased by 60.2 th. contracts. Sellers actively entered the market, buyers fled. Bears once again increased their control.
Growth scenario: we consider September futures, expiration date September 13. We have stopped the fall. It is possible to enter longing. Those who have already done it, hold positions.
Downside scenario: the market has fulfilled our target at 393.0. New short entry ideas will appear from the 440.0 area.
Recommendations for the corn market:
Buy: no. Who is in position from 393.0, move the stop to 391.0. Target: 440.0 (460.0).
Sale: no.
Support — 390.6. Resistance — 413.6.
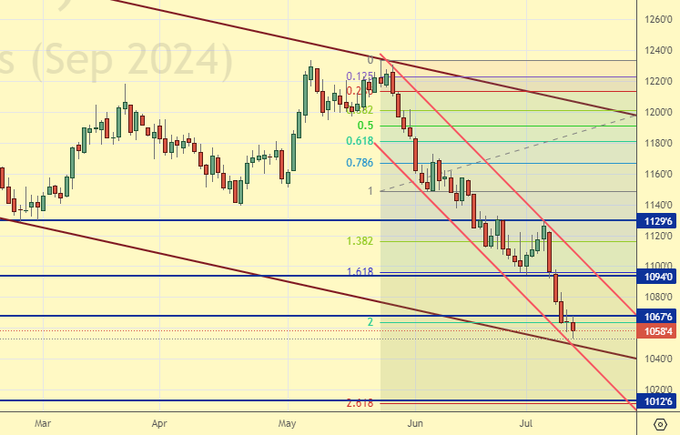
Soybeans No. 1. CME Group
Growth scenario: we consider September futures, expiration date September 13. It is possible that a deal from 1015 will be interesting. At the same time, we do not exclude the possibility of failure to 880.0.
Downside scenario: refrain from selling. The market is oversold.
Recommendations for the soybean market:
Buy: at touching 1015.0. Stop: 985.0. Target: 1090.0. Consider the risks!
Sale: no.
Support — 1012.6. Resistance — 1094.0.
Brent. ICE
Let’s look at the open interest volumes for Brent. You should take into account that this is three days old data (for Tuesday of last week), and it is also the most recent data published by the ICE exchange.
At the moment there are more open long positions of asset managers than short ones. Over the past week the difference between long and short positions of asset managers increased by 5.1 thousand contracts. Buyers entered the market, sellers also entered on small volumes. Buyers keep control over the market.
Growth scenario: we consider the July futures, expiration date July 31. One more downward price branch is possible before we return to growth. We are waiting for interesting levels at the bottom, for example 80.00. And then 99.90.
Downside scenario: we will continue to hold the short. We have to state that there are not many chances for its survival, but they are there.
Recommendations for the Brent oil market:
Buy: when approaching 80.20. Stop: 79.20. Target: 99.90.
Sell: no. Those in position from 86.54, move your stop to 87.60. Target: 80.20.
Support — 84.00. Resistance — 86.51.
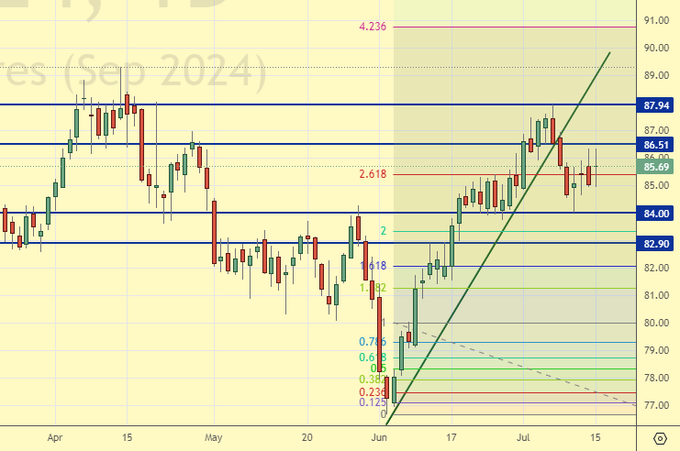
WTI. CME Group
US fundamental data: the number of active drilling rigs decreased by 1 unit to 478.
US commercial oil inventories fell by -3.443 to 445.096 million barrels, with +0.7 million barrels forecast. Gasoline inventories fell -2.006 to 229.666 million barrels. Distillate stocks rose 4.884 to 124.612 million barrels. Cushing storage inventories fell by -0.702 to 33.539 million barrels.
Oil production increased by 0.1 to 13.3 million barrels per day. Oil imports rose by 0.213 to 6.76 million barrels per day. Oil exports fell by -0.402 to 3.999 million barrels per day. Thus, net oil imports rose by 0.615 to 2.761 million barrels per day. Oil refining rose by 1.9 to 95.4 percent.
Gasoline demand fell -0.026 to 9.398 million barrels per day. Gasoline production rose by 0.239 to 10.3 million barrels per day. Gasoline imports fell -0.083 to 0.768 million barrels per day. Gasoline exports fell -0.052 to 0.919 million barrels per day.
Distillate demand fell by -0.249 to 3.466 million barrels. Distillate production rose by 0.022 to 5.128 million barrels. Distillate imports rose 0.045 to 0.139 million barrels. Distillate exports fell -0.602 to 1.103 million barrels per day.
Demand for petroleum products fell by -0.334 to 20.749 million barrels. Petroleum products production fell by -0.081 to 23.031 million barrels. Petroleum product imports fell -0.244 to 1.819 million barrels. Exports of refined products fell -0.593 to 6.523 million barrels per day.
Propane demand increased by 0.207 to 0.867 million barrels. Propane production fell -0.001 to 2.736 million barrels. Propane imports rose 0.026 to 0.105 million barrels. Propane exports fell -0.16 to 1.667 million barrels per day.
Let’s look at the WTI open interest volumes. You should take into account that this is three-day old data (for Tuesday of last week), and it is also the most recent data published by the CME Group exchange.
At the moment there are more open long positions of asset managers than short ones. During the past week the difference between long and short positions of asset managers increased by 15.4 th. contracts. Buyers were entering the market. Sellers were reducing positions. Bulls strengthened their control.
Growth scenario: we consider the August futures, expiration date July 22. We need a pullback to buy. Out of the market for now.
Downside scenario: we will continue to hold the short with downside targets at 76.30.
Recommendations for WTI crude oil:
Buy: when approaching 76.30. Stop: 75.30. Target: 95.00.
Sell: no. Those who are in position from 83.16, move your stop to 84.30. Target: 76.30.
Support — 80.86. Resistance — 84.54.
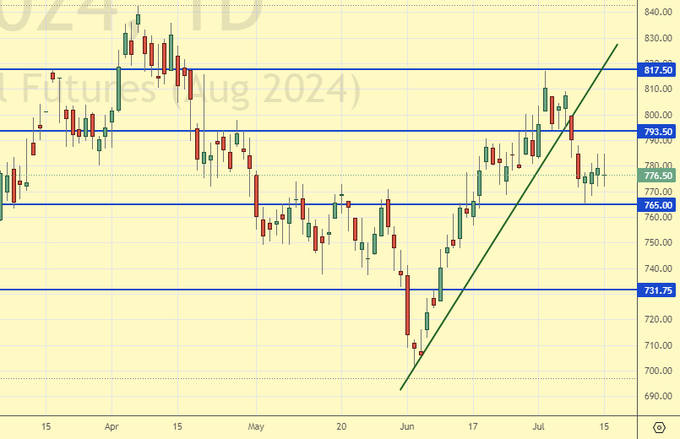
Gas-Oil. ICE
Growth scenario: we consider the August futures, expiration date August 12. We need correction. In case of a pullback to 735.00 it is possible to buy.
Downside scenario: keep shorts. We are counting on another downward wave.
Gasoil Recommendations:
Buy: on a pullback to 730.00. Stop: 720.00. Target: 950.00.
Sell: No. Those in position from 807.50, move your stop to 807.00. Target: 650.00!
Support — 765.00. Resistance — 793.50.
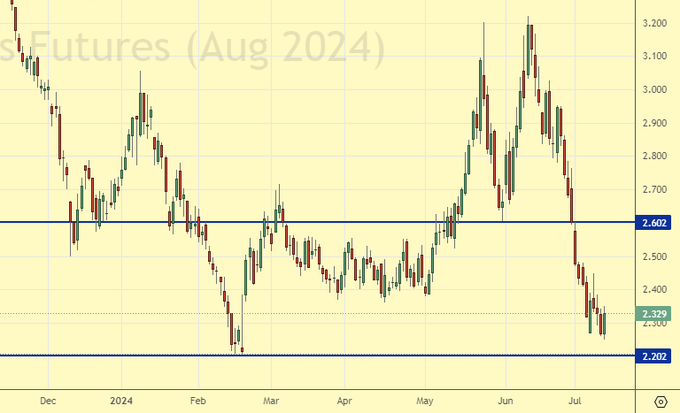
Natural Gas. CME Group
Growth scenario: we consider the August futures, expiration date July 29. We can buy. But you don’t want to. Out of the market.
Downside scenario: refrain from selling for now.
Natural Gas Recommendations:
Buy: no.
Sale: no.
Support — 2.202. Resistance — 2.602.
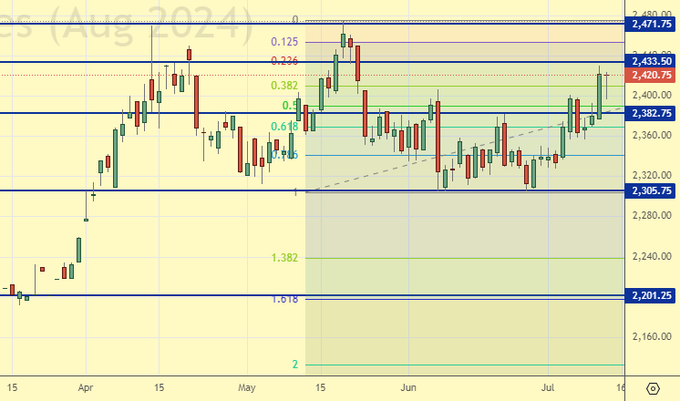
Growth scenario: we consider the August futures, expiration date August 28. For purchases we continue to want a correction. Buying from 2120 will be interesting. We need at least 2250. What is happening is not terrible, but the bulls are showing their strength here.
Downside scenario: so far the market is forgiving us. We made a mistake with shorts from 2350, but the situation has not gone away yet. We will short again, provided the market falls below 2397.
Gold Market Recommendations:
Buy: when approaching 2120. Stop: 2070. Target: 2650?!
Sell: on falling below 2397. Stop: 2425. Target: 2120.
Support — 2382. Resistance — 2433.
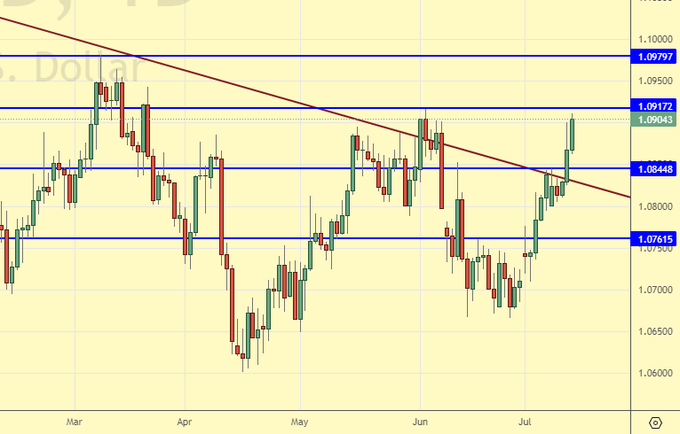
EUR/USD
Growth scenario: So we are above 1.0900. What do we do? Nothing. Out of the market.
Downside scenario: nothing has worked out for the sellers. Out of the market for now.
Recommendations on euro/dollar pair:
Buy: no.
Sale: no.
Support — 1.0844. Resistance — 1.0917.
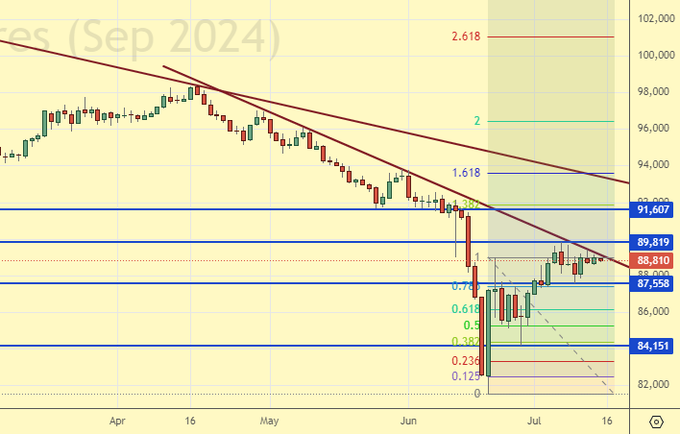
USD/RUB
Growth scenario: we consider September futures, expiration date September 19. A lull, not excluded before the storm. We are out of the market for now. From 74000 we buy it for sure.
Downside scenario: the technician does not deny further strengthening of the ruble. It will be interesting to sell from 90800, and we will recommend it.
Recommendations on dollar/ruble pair:
Buy: when approaching 74000. Stop: 72000. Target: 100.00.
Sell: on approach to 90800. Stop: 91800. Target: 76000.
Support — 87558. Resistance — 89819.
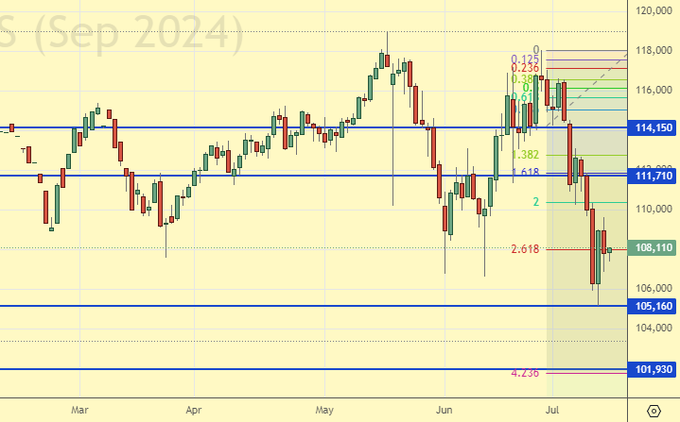
RTSI. MOEX
Growth scenario: we consider the September futures, expiration date September 19. We continue not to believe in the growth of the Russian market in dollars. Do not buy.
Downside scenario: keep short. Those who wish can increase their positions when the market rises to 112000. Those who did not sell earlier can also open down there.
Recommendations on the RTS index:
Buy: no.
Sell: no. Those who are in the position from 115200, move the stop to 115100. Target: 102000.
Support — 105160. Resistance — 111710.
The recommendations in this article are NOT a direct guide for speculators and investors. All ideas and options for working on the markets presented in this material do NOT have 100% probability of execution in the future. The site does not take any responsibility for the results of deals.
|
|
|