Price forecast from 10 to 14 March 2025

Comrade T. is trying to show the world the power of money. Here, look. This is China, see how small it is. Now I’m inflating it. Now it’s standing big. But as soon as it starts to inflate itself without my help, it must be deflated immediately. Otherwise it will get very big and swallow up its creator.
To New York’s Chinatown. Hello!
This release was prepared with the direct participation of analysts from trading platforms eOil.ru and IDK.ru. Here is an assessment of the situation on the global and Russian markets.
Grain market:
Yes, Beijing has responded to the nefarious attempts to defile the heart of the entire East by imposing retaliatory trade duties. The pale-faced demons from across the ocean cannot dictate to the Middle Kingdom how it should live and what it should do. Much less can they saw off a portion of China’s margins. But, no. They can. And they’re doing it. In response, red China in a united gust refuses to buy American soybeans and corn, which threatens the States with overstocking in case of a good harvest in the fall of ’25, and that’s why prices on the chart go south. However, no one will ever sell anything to anyone for nothing. At the very least they will distill it into alcohol or biofuel.
It is worth recognizing that in case of inability to find customers to buy their grain, the states may go for dumping their surplus at half price, which will lead to a distortion. Everyone will buy grain at a significant discount, including even those countries that are grain producers themselves. Let’s not point fingers at those countries. Why buy from your own farmer, when you can take it from overseas and feed your pigs with someone else’s grain, and then mix it with soy, which will also be almost free from the same States, and sell it to grandmothers in the form of sausage at Magnit.
Thus, a skew in the grain market is possible. But it will be an isolated case, because at low prices the same corn will be in short supply already in the 26th year. It will simply stop being planted. Thus, buying from deep in the grain market is not a bad strategy, but with a long time of realization.
Energy market:
The U.S. may begin the process of easing sanctions against Russia especially, but not necessarily, in the event of a shutdown of the SWO. Apparently, the altercation in the White House was not a production. And since it was, well… that’s fine.
If Washington is allowed to buy something from Russia, the rest of us are not forbidden to do so. And the lifting of financial sanctions — allowing them to pay in dollars without hindrance — will improve Russia’s position.
China continues to fulfill its norm of being the planet’s top importer by taking 10.38 million barrels of oil per day on average from the market, data for January and February show. They could potentially take more. Last year the figure was at 11.04, the year before at 11.28 million bpd. Russia supplies 20% of all imported oil to the Chinese market, and will be able to supply more because of the US-China trade war. India will not have to transport the goods, especially since Delhi refuses Russian supplies after communicating with its London comrades.
USD/RUB:
We are still standing in the range and even trying to strengthen. We are tired of political talk without any specifics. Europe’s intention to start producing something exploding at home for the pleasure of fools may be a significant negative, but if there is some contact with the States, there will be fewer headaches.
The ruble is able to strengthen up to 80.00 in case the SWO stops, if the strengthening happens without this event, then buying the dollar against the ruble from 80.00 is simply necessary.
Wheat No. 2 Soft Red. CME Group
Let’s look at the volumes of open interest in Wheat. You should take into account that this data is three days old (for Tuesday of last week), it is also the most recent data published by CME Group.
At the moment, there are more open short positions of asset managers than long positions. Over the past week the difference between long and short positions of asset managers increased by 17.6 thousand contracts. Both buyers and sellers entered the market, but sellers were more numerous. Bears are controlling the situation.
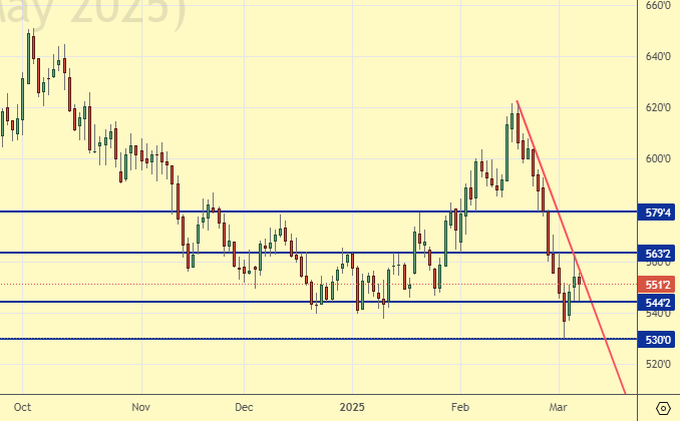
Growth scenario: we consider the May contract, expiration date is May 14. Attempts to pass to 500.0 cannot be excluded. If it happens, it is worth allocating a little more money to buy than usual.
Downside scenario: it is better not to think about shorts. Out of the market.
Recommendations for the wheat market:
Buy: mandatory when approaching 500.0. Stop: 400.0. Target: 700.0.
Sell: none.
Support: 544.2. Resistance: 563.2.
Corn No. 2 Yellow. CME Group
Let’s look at the volumes of open interest in Corn. You should take into account that this data is three days old (for Tuesday of last week), it is also the most recent of those published by the CME Group exchange.
At the moment, there are more open long positions of asset managers than short positions. Over the past week the difference between long and short positions of asset managers decreased by 127 thousand contracts. Buyers decided to leave the market. Sellers became a little more. Bulls still continue to control the situation.
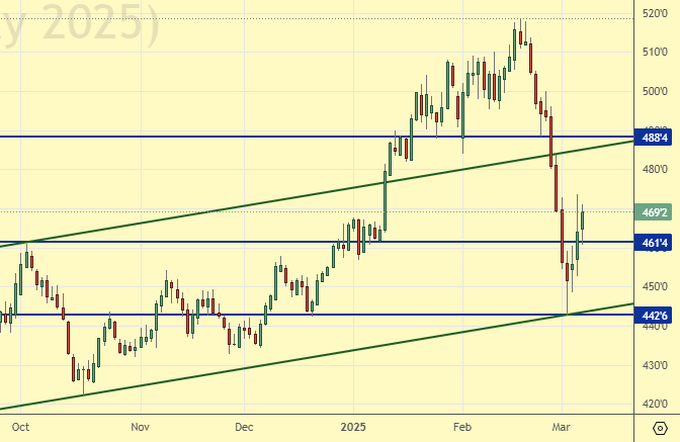
Growth scenario: we consider the May contract, expiration date is May 14. We managed to cling on from 444.0. We should hold the long. If it does not work, it makes sense to buy from deeper marks. Buying will be the main idea for a long period of time.
Downside scenario: it makes no sense to sell at current prices. Go short only if we go to 490.0 quickly.
Recommendations for the corn market:
Buy: none. Those who are in a position from 444.0, move the stop to 445.0. Target: 510.0.
Sell: when approaching 488.0. Stop: 498.0. Target: 380.0?!!!
Support: 461.4. Resistance: 488.4.
Soybeans No. 1. CME Group
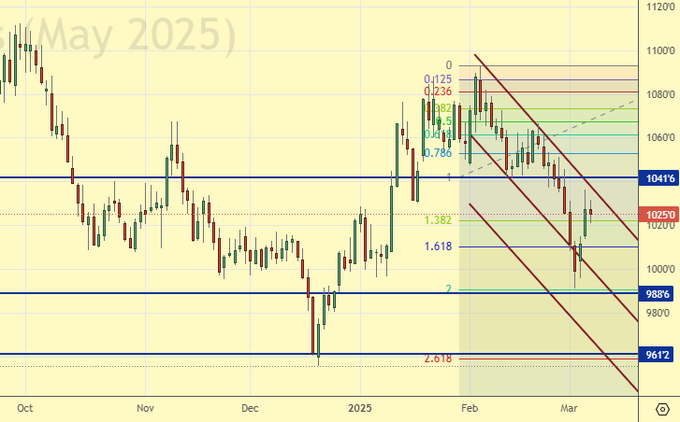
Growth scenario: we consider the May contract, expiration date May 14. Buying on the background of China’s refusal to buy American agricultural products looks premature. Out of the market.
Downside scenario: soybeans have been and will be plentiful. For now it is possible to continue shorting.
Recommendations for the soybean market:
Buy: none.
Sell: on a rise to 1040.0. Stop: 1056.0. Target: 878.0. Who is in position from 1025.6, keep stop at 1056.0. Target: 878.0.
Support: 988.6. Resistance: 1041.6.
Brent. ICE
Let’s look at the open interest volumes for Brent. You should take into account that this is three days old data (for Tuesday of last week), and it is also the most recent data published by the ICE exchange.
At the moment there are more open long positions of asset managers than short ones. Over the past week the difference between long and short positions of asset managers decreased by 61.8 thousand contracts. The change is significant. Buyers are fleeing for the second week in a row, sellers have been steadily arriving. Bulls are still in control of the situation.
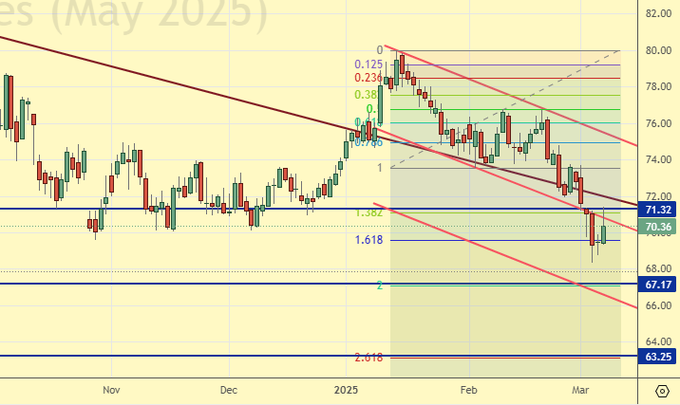
Growth scenario: we consider the March futures, expiration date March 31. So far we can’t turn around. It is worth buying from 63.30, but we need to get there first.
Downside scenario: it is worth being patient and keeping shorts. The consequences of a trade war could be severe for the oil market.
Recommendations for the Brent oil market:
Buy: when approaching 63.30. Stop: 62.00. Target: 72.00.
Sell: no. Those who are in the position from 74.05, move the stop to 74.10. Target: 60.00.
Support: 67.17. Resistance: 71.32.
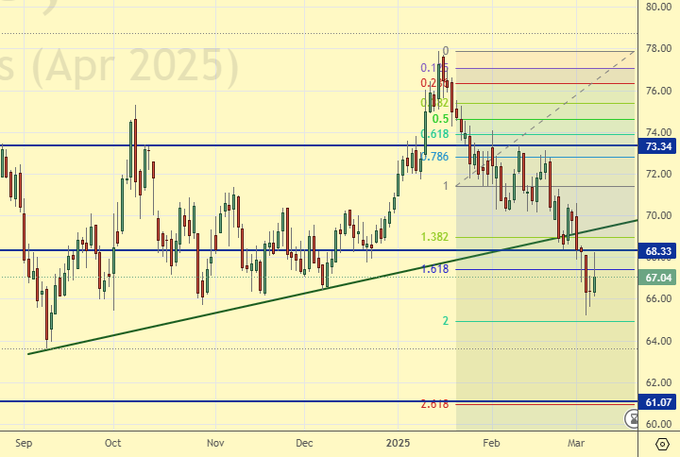
WTI. CME Group
US fundamental data: the number of active drilling rigs is unchanged at 486.
US commercial oil inventories rose by 3.614 to 433.775 million barrels, with +0.6 million barrels forecast. Gasoline inventories fell -1.433 to 246.838 million barrels. Distillate stocks fell -1.318 to 119.154 million barrels. Cushing storage stocks rose by 1.124 to 25.697 million barrels.
Oil production rose by 0.006 to 13.508 million barrels per day. Oil imports fell by -0.106 to 5.813 million barrels per day. Oil exports fell by -0.052 to 4.136 million barrels per day. Thus, net oil imports fell by -0.054 to 1.677 million barrels per day. Oil refining fell -0.6 to 85.9 percent.
Gasoline demand increased by 0.423 to 8.877 million barrels per day. Gasoline production increased by 0.464 to 9.634 million barrels per day. Gasoline imports rose 0.141 to 0.603 million barrels per day. Gasoline exports fell -0.033 to 0.816 million barrels per day.
Distillate demand fell -0.106 to 3.991 million barrels. Distillate production fell by -0.587 to 4.575 million barrels. Distillate imports fell -0.101 to 0.269 million barrels. Distillate exports rose -0.164 to 1.041 million barrels per day.
Demand for petroleum products fell by -0.299 to 20.543 million barrels. Petroleum products production fell by -0.014 to 21.647 million barrels. Imports of refined petroleum products rose 0.435 to 2.08 million barrels. Exports of refined products rose by 1.65 to 7.006 million barrels per day.
Propane demand fell -0.86 to 1.058 million barrels. Propane production rose 0.033 to 2.69 million barrels. Propane imports rose 0.068 to 0.203 million barrels. Propane exports rose 0.842 to 2.248 million barrels per day.
Let’s look at the WTI open interest volumes. You should take into account that this is three-day old data (for Tuesday of last week), and it is also the most recent data published by the CME Group exchange.
At the moment there are more open long positions of asset managers than short ones. Over the past week the difference between long and short positions of asset managers increased by 29.9 th. contracts. Buyers were retreating. Sellers were actively leaving the market. Bulls retain control.
Growth scenario: we consider April futures, expiration date March 20. Beautiful development of the upward impulse did not turn out. Still out of the market.
Downside scenario: we can sell. If we can’t go up in the next couple of days, it could lead to a collapse.
Recommendations for WTI crude oil:
Buy: when approaching 61.20. Stop: 60.20. Target: 68.00.
Sell: no. Those who are in the position from 69.76, move your stop to 69.70. Target: 61.20.
Support: 61.07. Resistance: 68.33.
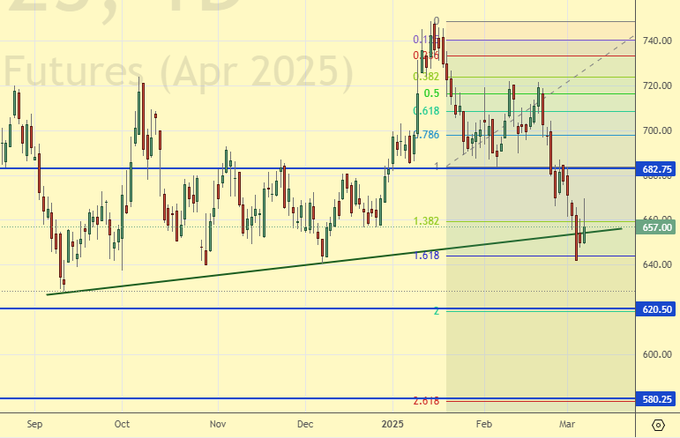
Gas-Oil. ICE
Growth scenario: we consider the March futures, expiration date March 12. To buy, we should wait for the momentum downward to fully work out, which will happen, perhaps, at 580.0.
Downside scenario: if there will be growth, it can be used for short entry.
Gasoil recommendations:
Buy: when approaching 580.0. Stop: 570.0. Target: 680.0.
Sell: on approach to 680.0. Stop: 700.0. Target: 580.00.
Support: 620.50. Resistance: 682.75
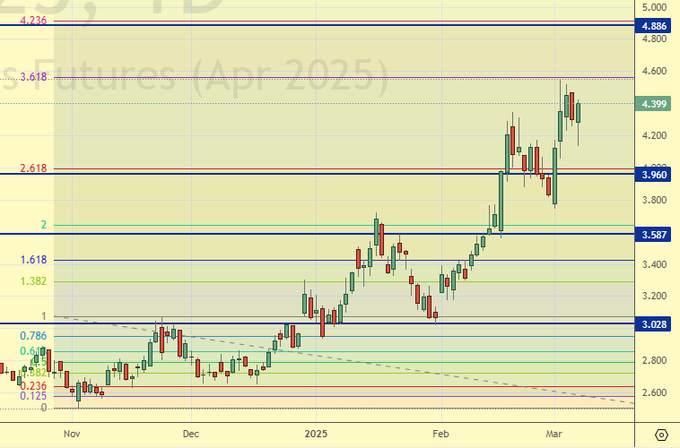
Natural Gas. CME Group
Growth scenario: we consider April futures, expiration date March 27. There are no good levels for buying. Out of the market.
Downside scenario: shorting will be interesting from 4.890. Do not sell at current levels.
Natural gas recommendations:
Buy: none.
Sell: when approaching 4.880. Stop: 5.100. Target: 3.100.
Support: 3.960. Resistance: 4.886.
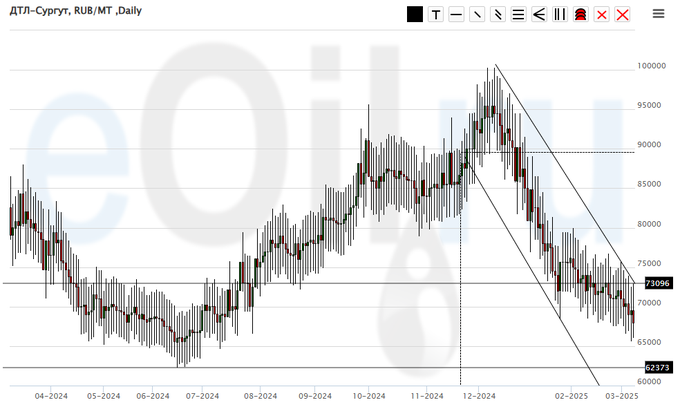
Diesel arctic fuel, ETP eOil.ru
Growth scenario: knocked out of buying. We take a pause.
Downside scenario: we will not sell anything. There is a constant risk of a sudden price rise.
Diesel market recommendations:
Buy: no.
Sell: no.
Support: 62373. Resistance: 73096.
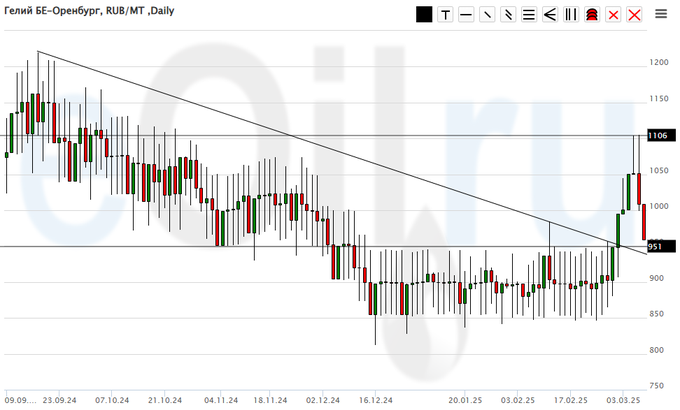
Helium (Orenburg), ETP eOil.ru
Growth scenario: continue to stand in longs, expecting further price growth.
Downside scenario: we remain out of the market, prices are low.
Recommendations for the helium market:
Buy: none. Those in a position from 900, move your stop to 860. Target: 2000.
Sell: no.
Support: 951. Resistance: 1106.
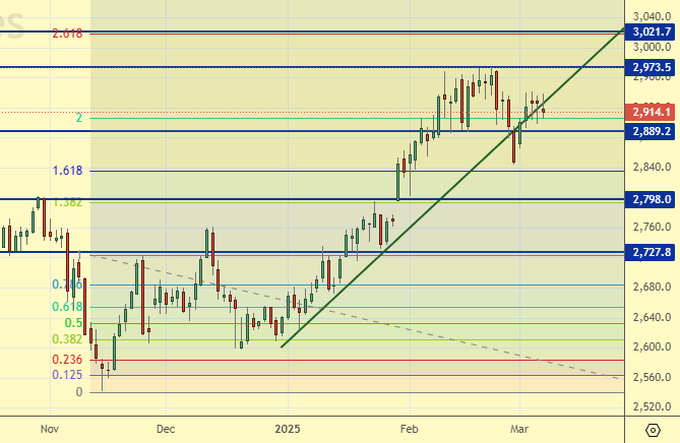
Growth scenario: we consider the March futures, expiration date March 27. We continue to believe that when approaching 2730 we can buy. There is nothing else interesting here.
Downside scenario: If we don’t see 3020, it will be a very strong bearish signal. Don’t forget that we are at the highs, and it is fun to fall from them.
Gold Market Recommendations:
Buy: when approaching 2730. Stop: 2710. Target: 3020.
Sell: now (2914). Stop: 2944. Target: 2120.
Support: 2889. Resistance: 2973.
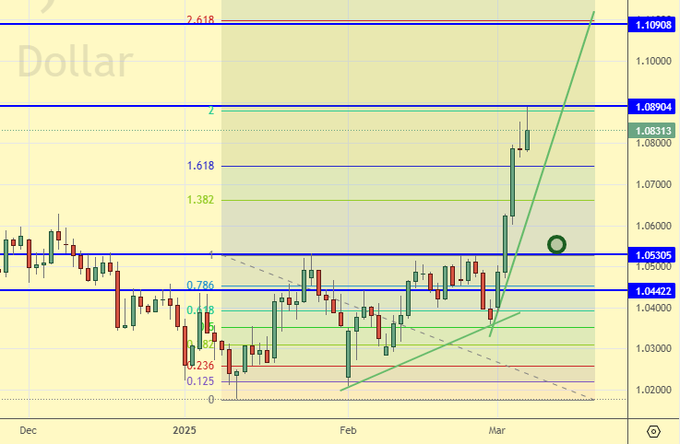
EUR/USD
Growth scenario: we went above 1.0530, and quickly. We were interested in this level, but we were not able to buy. We will wait for a pullback.
Downside scenario: in such a situation, it is better to sell at the rise to 1.0450. If the market does not give such an opportunity, it is better to do nothing.
Euro/dollar pair recommendations:
Buy: on a pullback to 1.0550. Stop: 1.0450. Target: 1.1090 (1.2000).
Sell: none.
Support: 1.0530. Resistance: 1.0890.
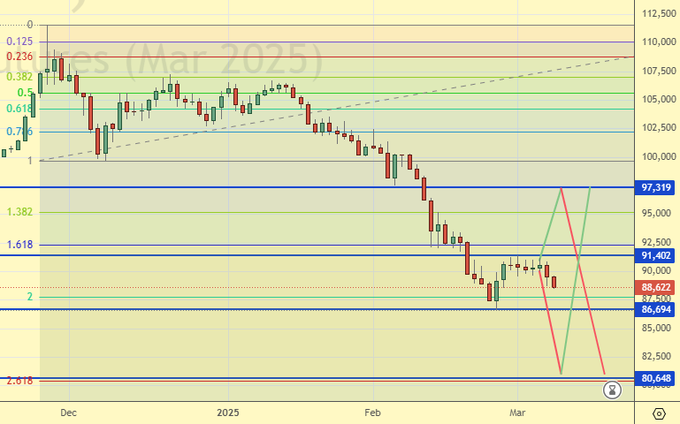
USD/RUB
Growth scenario: we consider March futures, expiration date March 20. From 81000 to buy unambiguously. The last couple of days we looked downward, it is possible that the bearish movement will develop. But we will work off the level of 87500 to buy.
Downside scenario: we have no right to miss the move to 81000. We should sell.
Recommendations for dollar/ruble pair:
Buy: when approaching 87500. Stop: 86500. Target: 97300. Also when approaching 81000. Stop: 79000. Target: 115000!!!
Sell: now (88622). Stop: 90600. Target: 81200.
Support: 86694. Resistance: 91402.
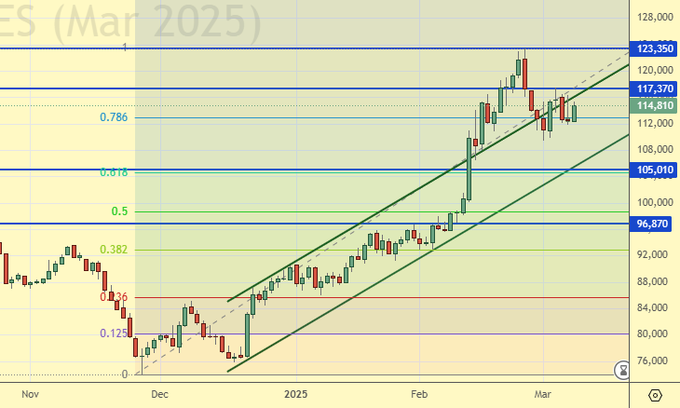
RTSI. MOEX
Growth scenario: we consider the March futures, expiration date March 20. Yes, we are interested in 93000 level for buying, but longing from 105000 is also worth considering.
Downside scenario: the idea remains the same. If there will be an approach to 120000 — sell. Within the correction we can draw the trajectory 120000 — 105000.
Recommendations on RTS index:
Buy: when approaching 105000. Stop: 103000. Target: 138000!!! Also when approaching 93300. Stop: 91300. Target: 110000.
Sell: on approach to 120000. Stop: 122,000. Target: 105000.
Support: 105010. Resistance: 117370.
The recommendations in this article are NOT a direct guide for speculators and investors. All ideas and options for working on the markets presented in this material do NOT have 100% probability of execution in the future. The site does not take any responsibility for the results of deals.